Object Groupings (MHN)
Maslow Hierarchy of Need’s (MHN) Groupings
Rationale
The six groupings used here follow the extended model of Maslow’s Hierarchy of Needs presented on the Maslow Explained page, and are central to the approach outlined in both Framing the Problem and What We’re Looking For. Each level represents a category of evolved human need understood not in abstract or symbolic terms, but as observable, developmental conditions shaped by biology and experience.
Classifications were based on clear visual indicators only, as described in the Method section, and reviewed with support from Gemini 2.5 to ensure consistency. Labels without a direct visual link to one or more levels were excluded, following guidance from Maslow’s later work (Maslow, 1967; Koltko-Rivera, 2006).
Methodology
To map Clarifai’s object detection outputs onto Maslow’s Hierarchy of Needs, a cleaned list of high-confidence labels (≥ 0.87) was passed to Gemini 2.5 and classified according to six clearly defined Maslow levels. Only visible, concrete objects were considered; abstract or symbolic terms were excluded. Each label was assigned a level only if it directly and visibly supported a core human need, following strict criteria based on Maslow’s later work (Maslow, 1969; Koltko-Rivera, 2006). This enabled each image to be annotated with the presence or absence of evolved need fulfilment across the six tiers.
Visual Representation
This graph visualises how each Maslow need level is distributed across different search themes, based on the presence of visible, concrete objects identified in Clarifai image data. Each bar represents a thematic search category (e.g. “connection”, “technology addiction”), broken down by the relative presence of six core human needs, from physiological survival to self-transcendence.
To enable fair comparison, I applied double normalisation. First, for each image, calculated the sum proportion of visible objects that corresponded to each need level. These proportions were then averaged across all images within each search category. Finally, the data was scaled so that each Maslow level is evenly weighted across the full graph, showing how the fulfilment of each need is distributed across different cultural themes.
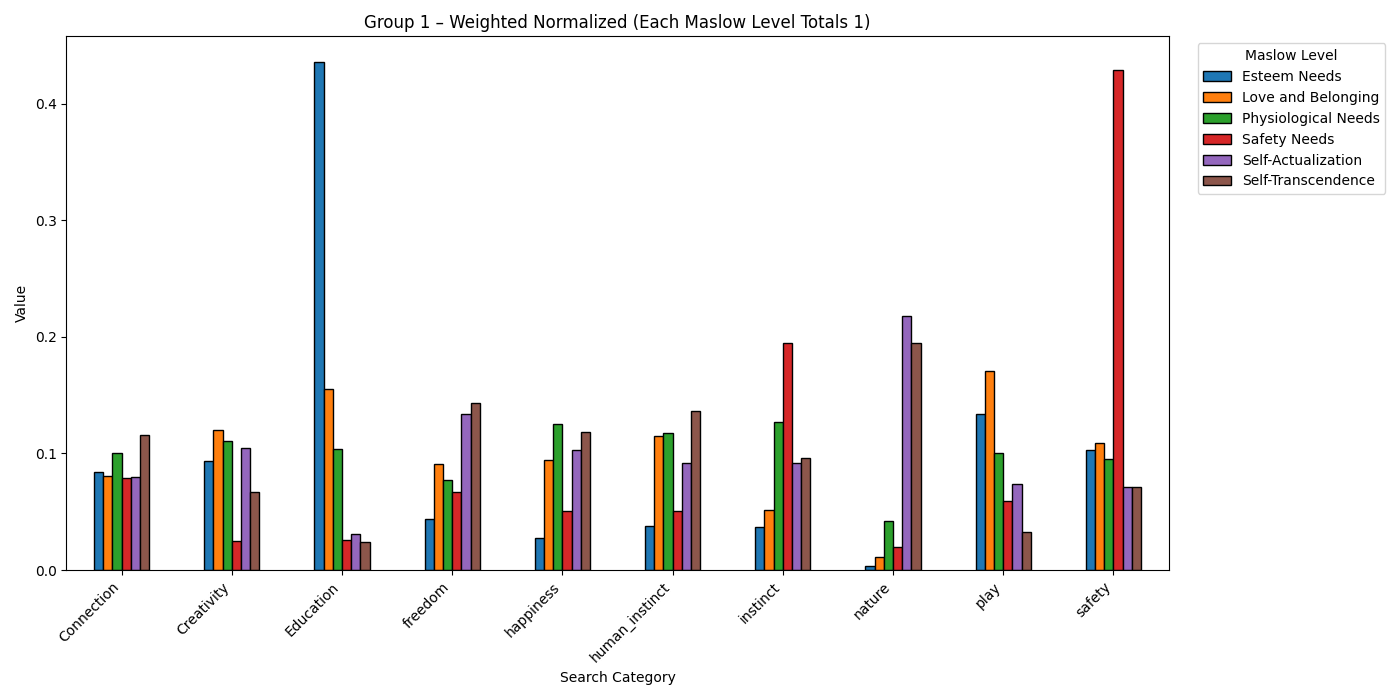
Figure 1. Group 1 – Presence of MHN Visual Object Groupings by Search Term -Represented as weighted and normalised data
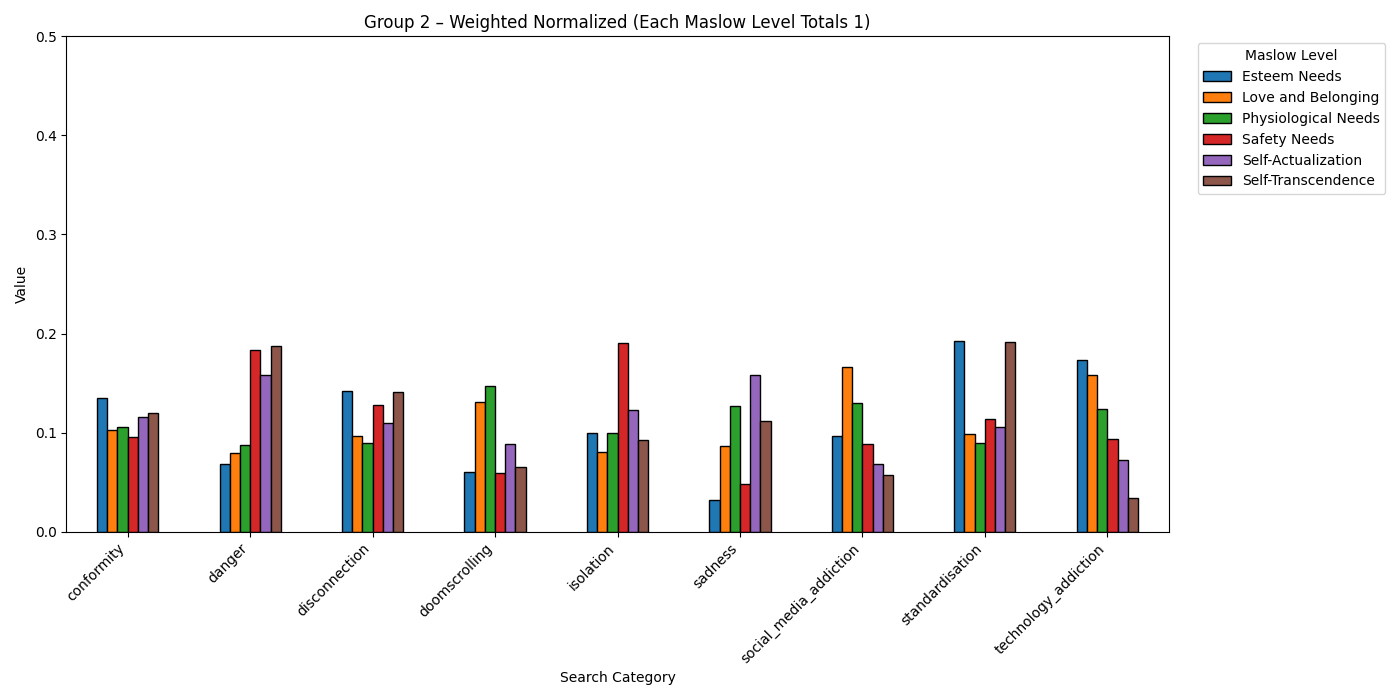
Figure 2. Group 2 – Presence of MHN Visual Object Groupings by Search Term – Represented as weighted and normalised data
Weighted Normalised Matrix
A weighted normalised matrix approach was used to compare how different types of objects (DA groups) are distributed across search themes. By weighting each object and normalising results, the analysis fairly reveals which themes are most visually associated with each core element of human experience, removing bias from sample size or image complexity.