Object Groupings (DA)
Developmental Affordance (DA) Groupings
Rationale
The ten groupings reflect the core elements that make up the physical and relational world we inhabit. Rather than being discrete domains or diagnostic categories, they are interwoven aspects of the environments humans have evolved within and continue to depend on for regulation, vitality, and coherence. Grounded in research across evolutionary biology, environmental psychology, and systems thinking, these categories represent the kinds of inputs that are not only visible in images, but constitutive of life itself: the people we encounter, the food we eat, the landscapes we move through, the tools we use, and the forms of connection and expression that shape our daily experience (Bronfenbrenner, 2013; Chawla, 2015; Geist, 2013).
To support consistency and reduce semantic ambiguity across the large-scale dataset, this grouping process was also discussed with Gemini 2.5, which viewed the 20 csv files and helped ensure that the vast majority of physical object labels identified by Clarifai could be interpreted and organised in line with these ten interdependent categories.
Methodology
To translate Clarifai’s raw object detection outputs into a structured representation of evolved human needs, I developed a custom Python script that processed and semantically grouped over 20 .csv files of labelled image data. First, all files were merged and deduplicated, with duplicate object columns (e.g. tree, tree.1) collapsed using maximum confidence scores. Only labels with a confidence score ≥ 0.87 aligning with threshold identified on Object Detection API Analysis Results.
To reduce semantic ambiguity, object labels were cleaned and standardised before being passed to Gemini 2.5, which classified them into one of ten pre-defined DA categories — such as Humans, Plants, Food, or Tools, according to strict criteria. Only labels referring to visible, concrete objects were included; abstract, emotional, stylistic, or symbolic terms were excluded.
Each image was then annotated with the presence of objects from these categories, generating a clean, interpretable table that maps physical, evolved need-domains across the dataset. This forms the foundation for subsequent analysis of how different types of needs are visually represented or neglected in everyday cultural imagery.
Visual Representation
This graph presents the distribution of physical object categories across different search themes, using quantitative data extracted from Clarifai image labels. Each bar corresponds to a search theme and is subdivided to show the relative prevalence of objects within ten “evolved-need” domains, including Humans, Food, Plants, and Tools.
To ensure meaningful and fair cross-theme comparisons, a double normalisation procedure was applied. First, for every image, the sum proportion of detected objects belonging to each DA category (for example, 3 humans and 2 plants yields 60% Humans, 40% Plants). These proportions were then averaged across all images in each theme, producing a representative distribution per category. Second, the resulting values for each object class were normalised so that their total across all themes sums to 100%, highlighting the relative association of each object type with each theme.
This dual-step normalisation accounts for variations in sample size and object density, providing a balanced view of the data. Alternative visualisations (including raw and single-weighted versions) are available separately for comparison.
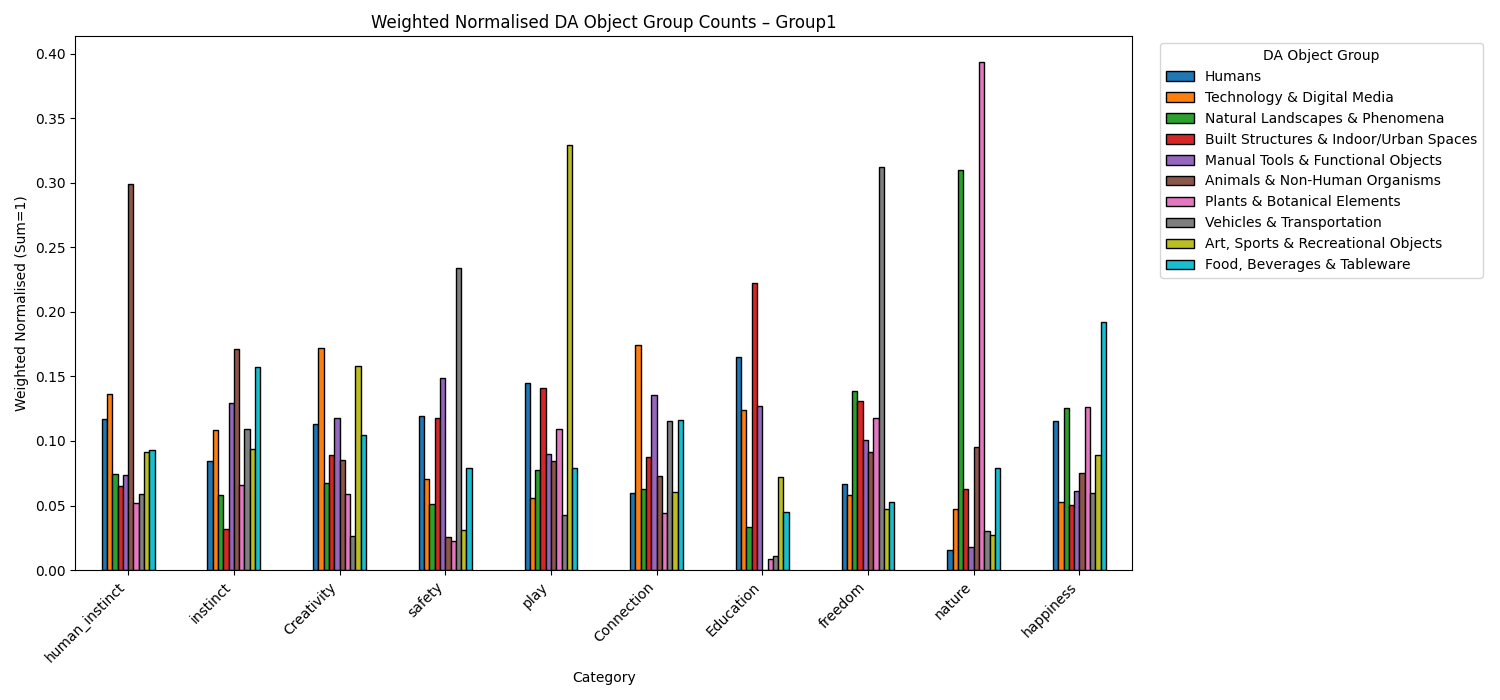
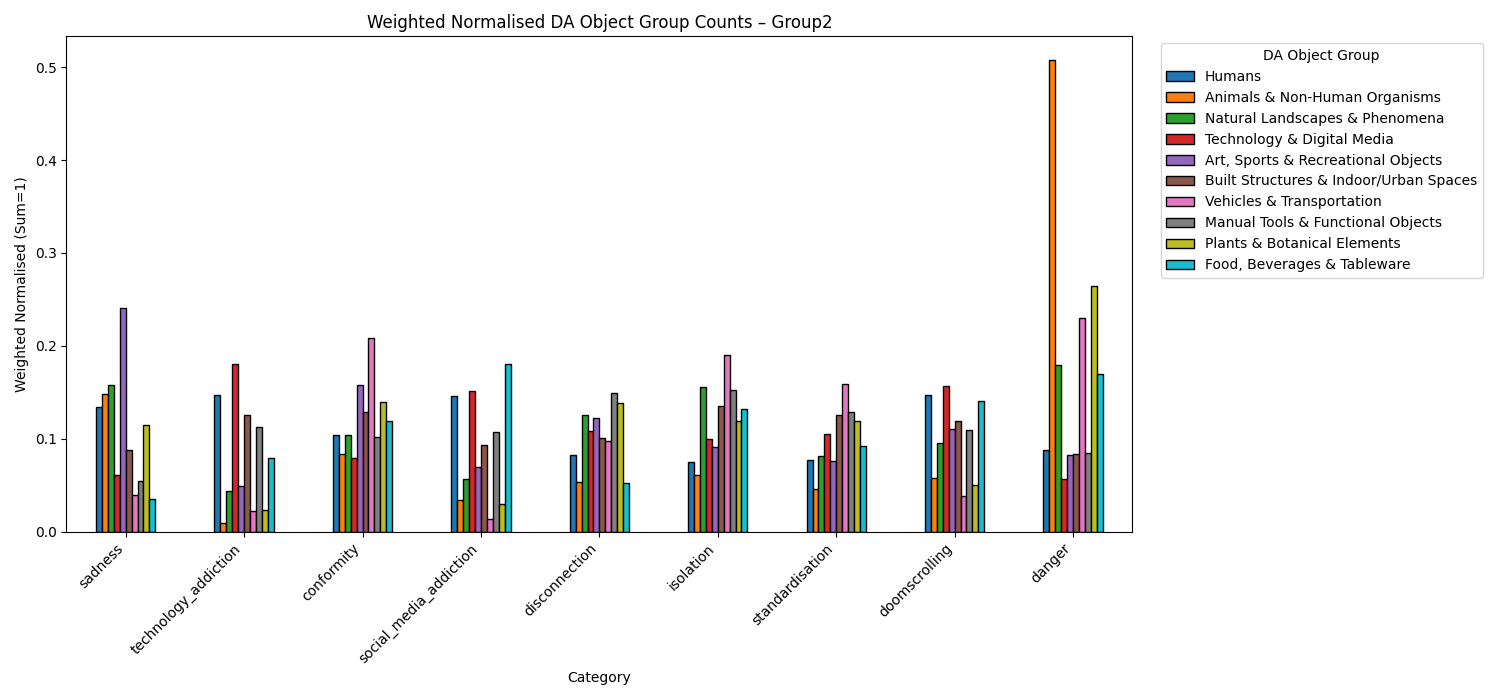
Weighted Normalised Matrix
A weighted normalised matrix approach was used to compare how different types of objects (DA groups) are distributed across search themes. By weighting each object and normalising results, the analysis fairly reveals which themes are most visually associated with each core element of human experience, removing bias from sample size or image complexity.