Dataset Description
Dataset Diversity & Object Novelty
Shannon Diversity Analysis
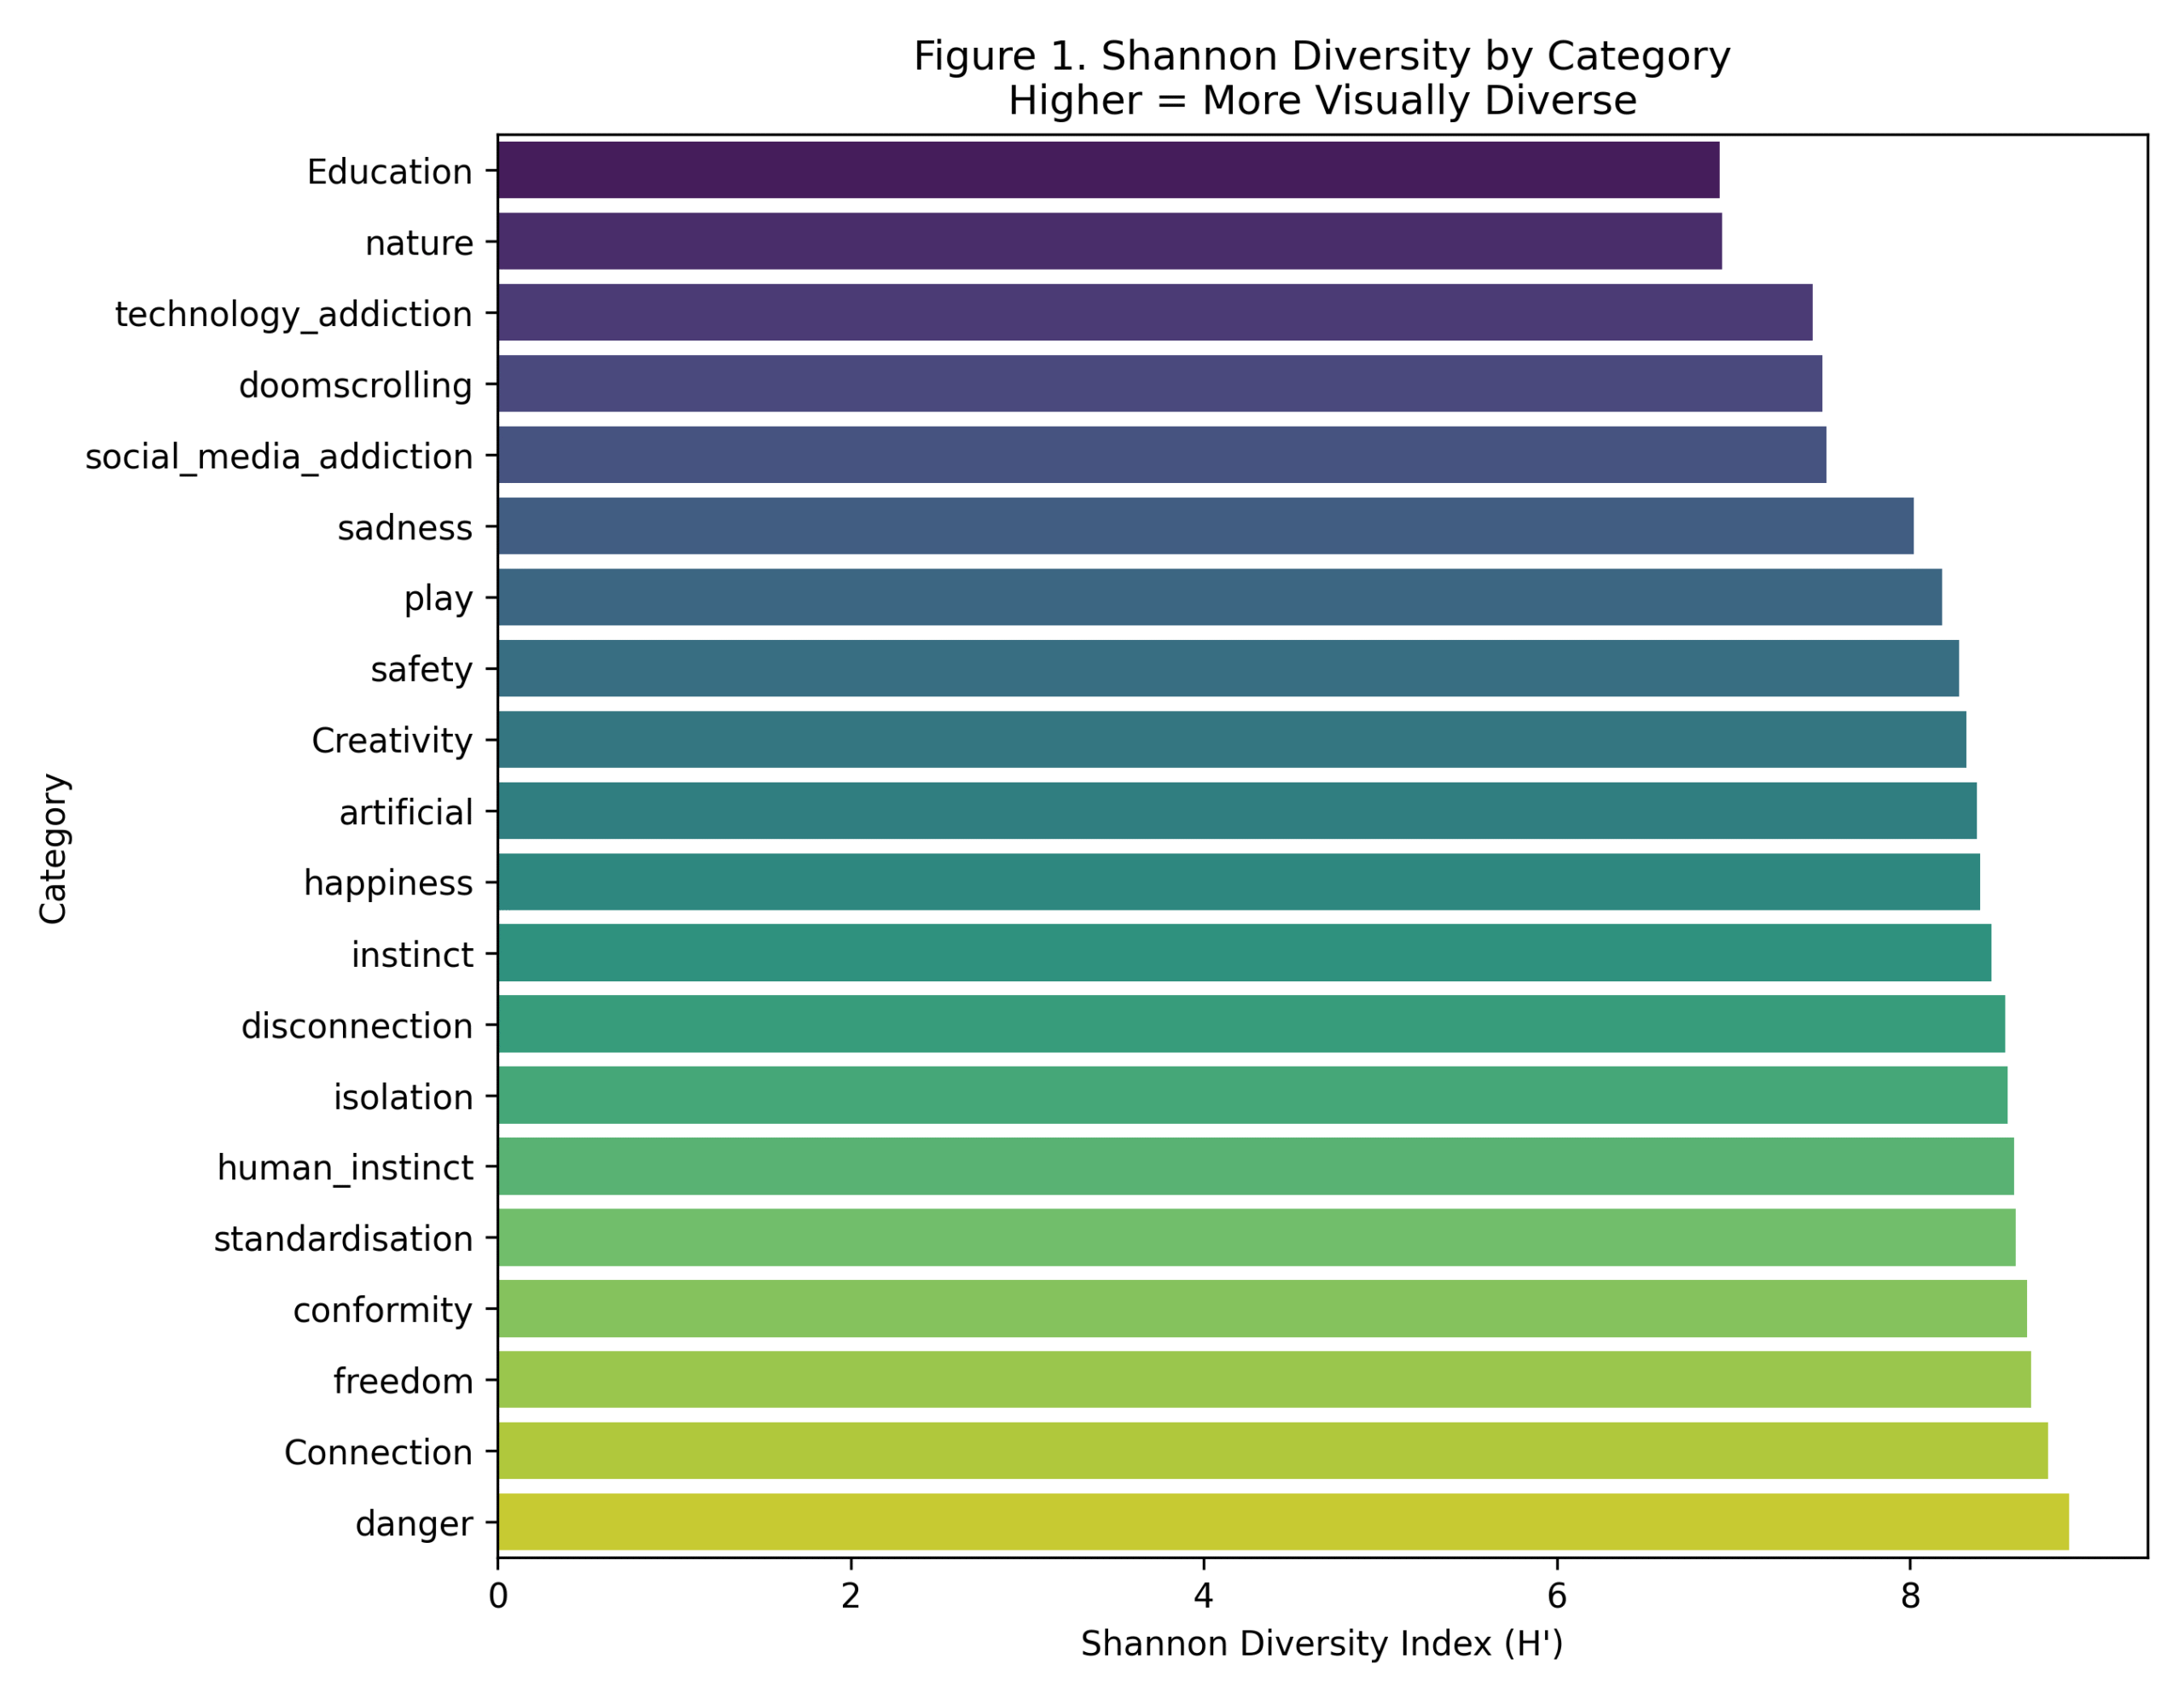
The Shannon Diversity Index (H’) was employed to quantify visual content diversity across categories, as it is particularly sensitive to rare objects and provides robust comparisons across unequal sample sizes. The analysis reveals significant heterogeneity in visual richness across conceptual categories (H’ range: 6.923–8.901, SD = 0.596).
Formula: H = –Σ(p₁ × log₂(p₁))
- Higher values (in bits) indicate more diverse and unpredictable content.
- Lower values indicate more focused or consistent themes.
Methodological Rationale:
Shannon diversity was selected over simple species counts because it accounts for both richness (number of unique objects) and evenness (distribution of object frequencies), providing a more nuanced measure of visual complexity that is essential for understanding how abstract concepts are visually represented.

Key Findings
Visual Diversity Hierarchy:
Categories demonstrate a clear hierarchy of visual richness. “Danger” exhibits the highest diversity (H’ = 8.901), followed by “Connection” (H’ = 8.784) and “Freedom” (H’ = 8.686). Conversely, “Education” (H’ = 6.923) and “Nature” (H’ = 6.935) show the lowest diversity, suggesting more stereotypical visual representations.
Statistical Distribution:
The diversity distribution is approximately normal with no statistical outliers (IQR method), indicating systematic rather than random variation in visual content. The coefficient of variation (0.073) suggests moderate but meaningful differences between categories.
Correlation Analysis
Strong Positive Correlations were observed between Shannon diversity and:
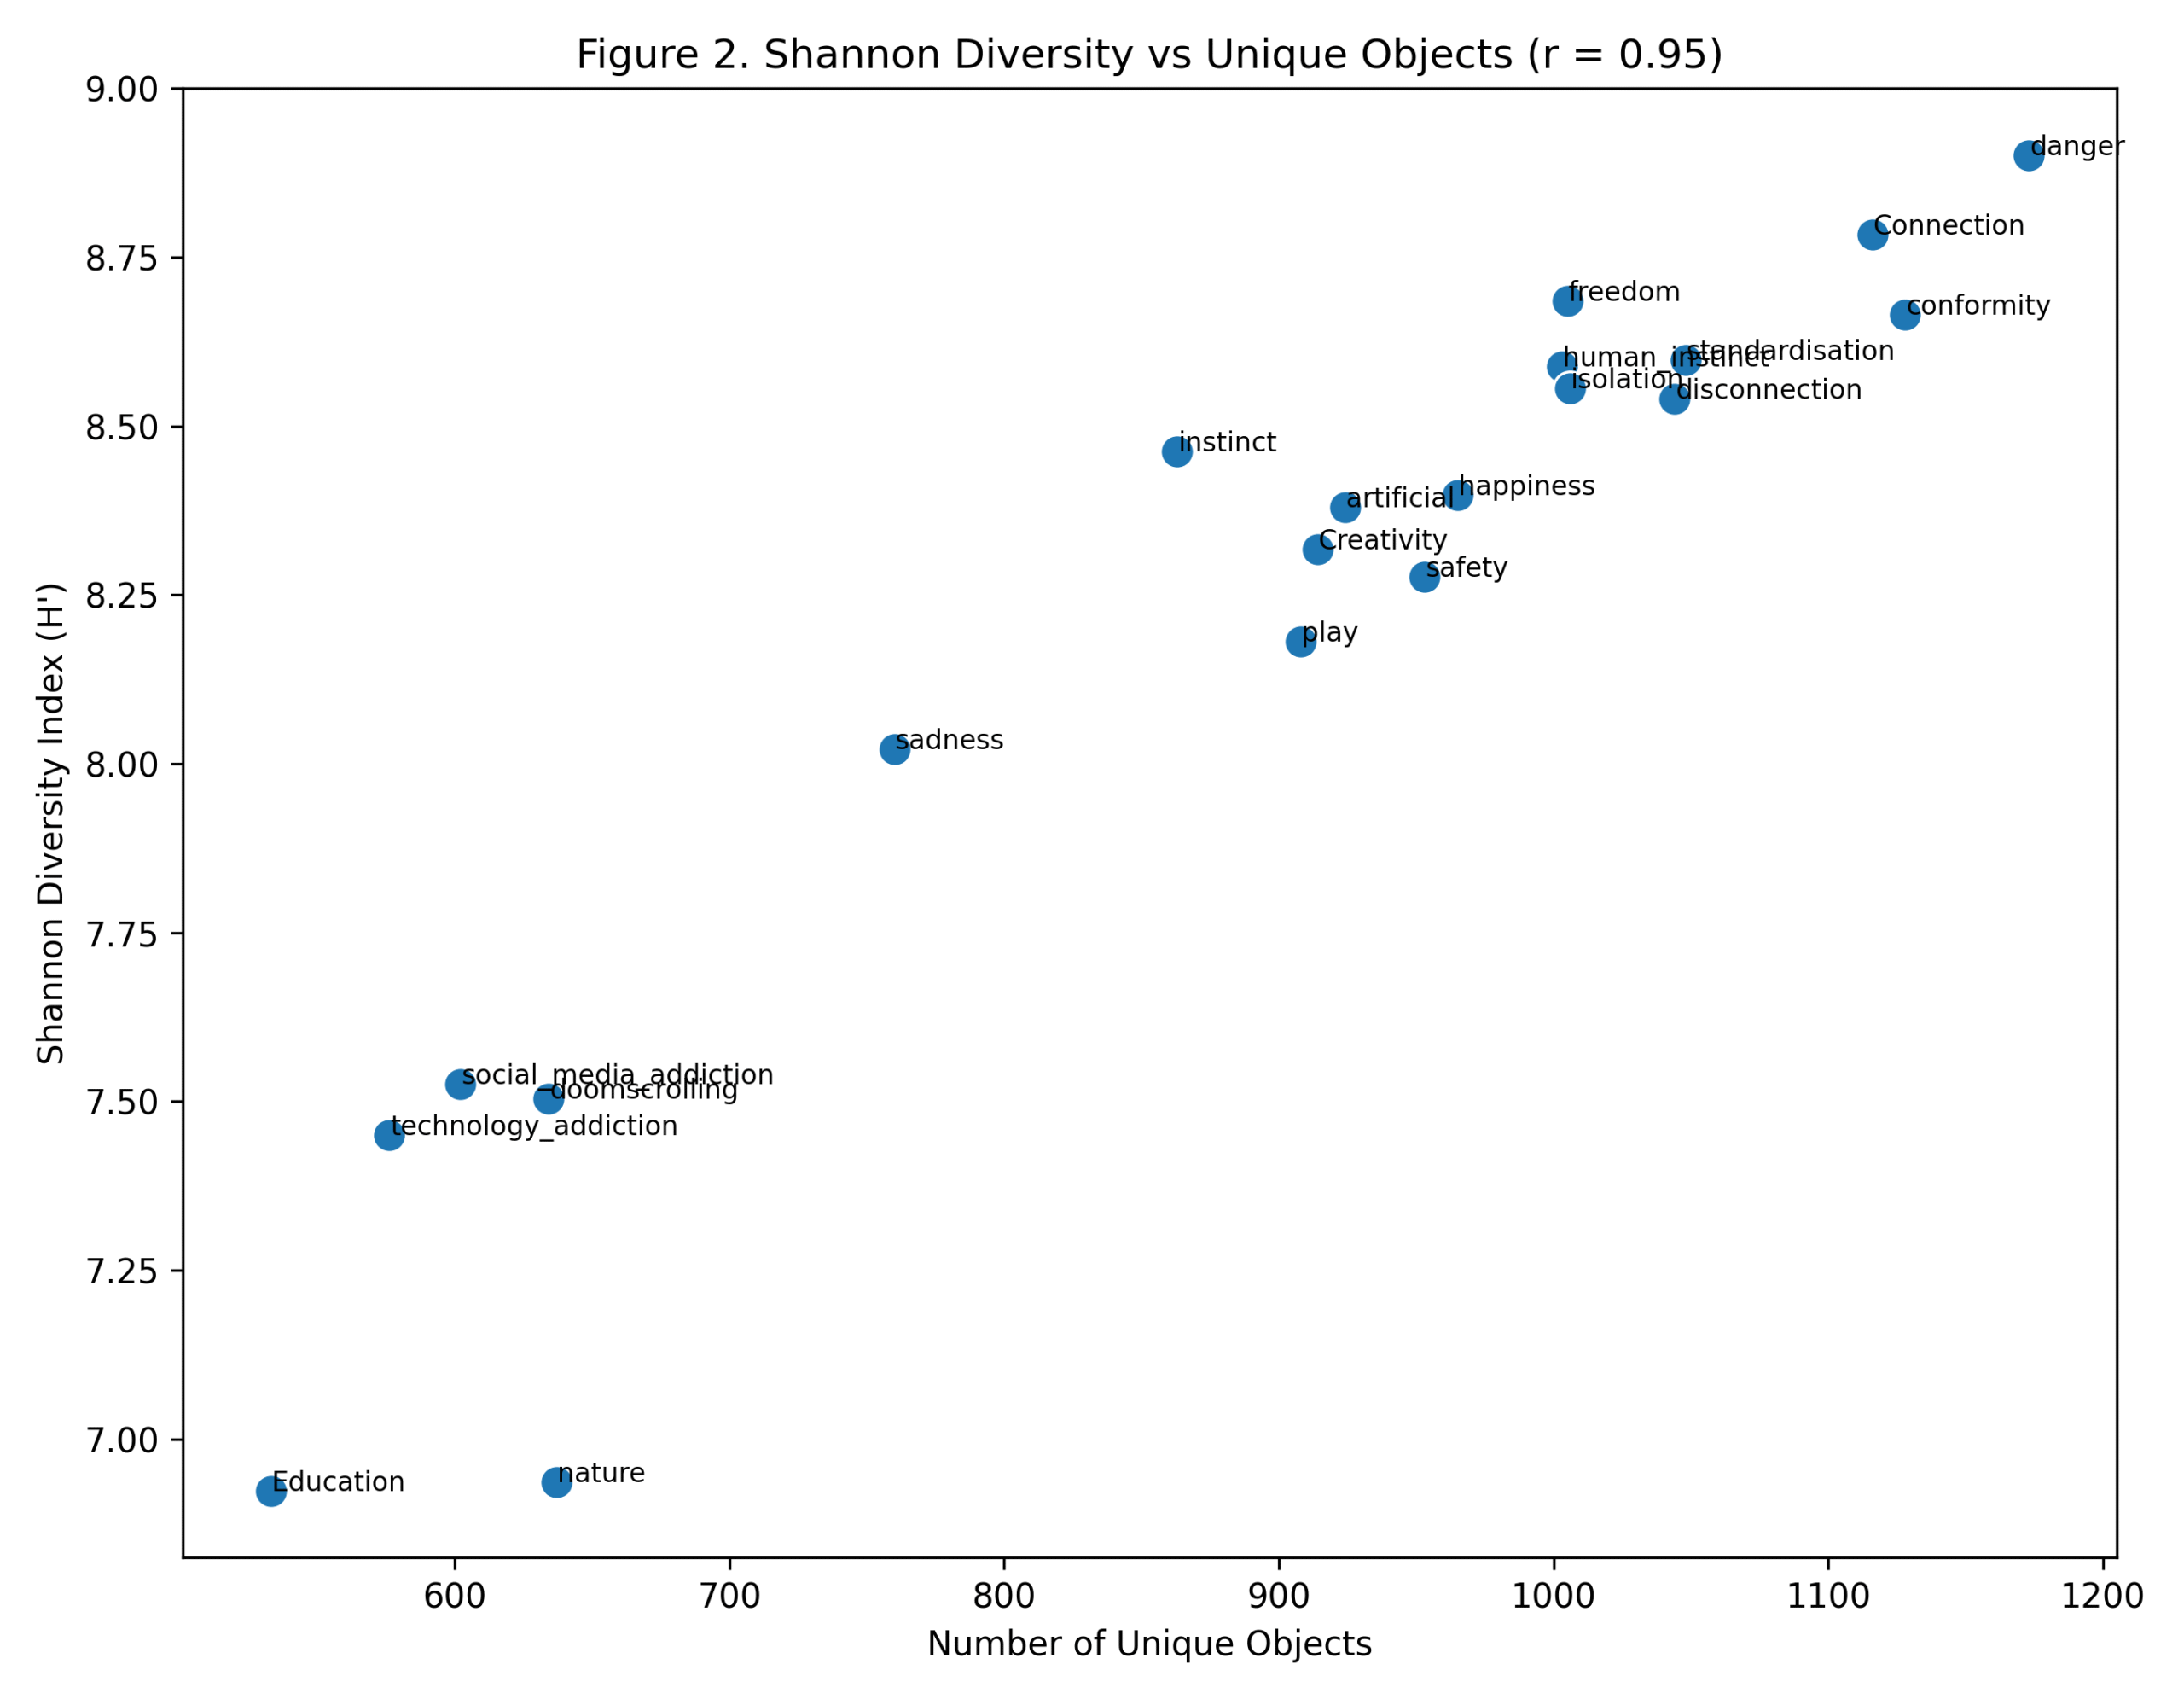
- Unique objects (r = 0.951, p < 0.001): Highly significant, indicating that diverse categories contain more distinct visual elements
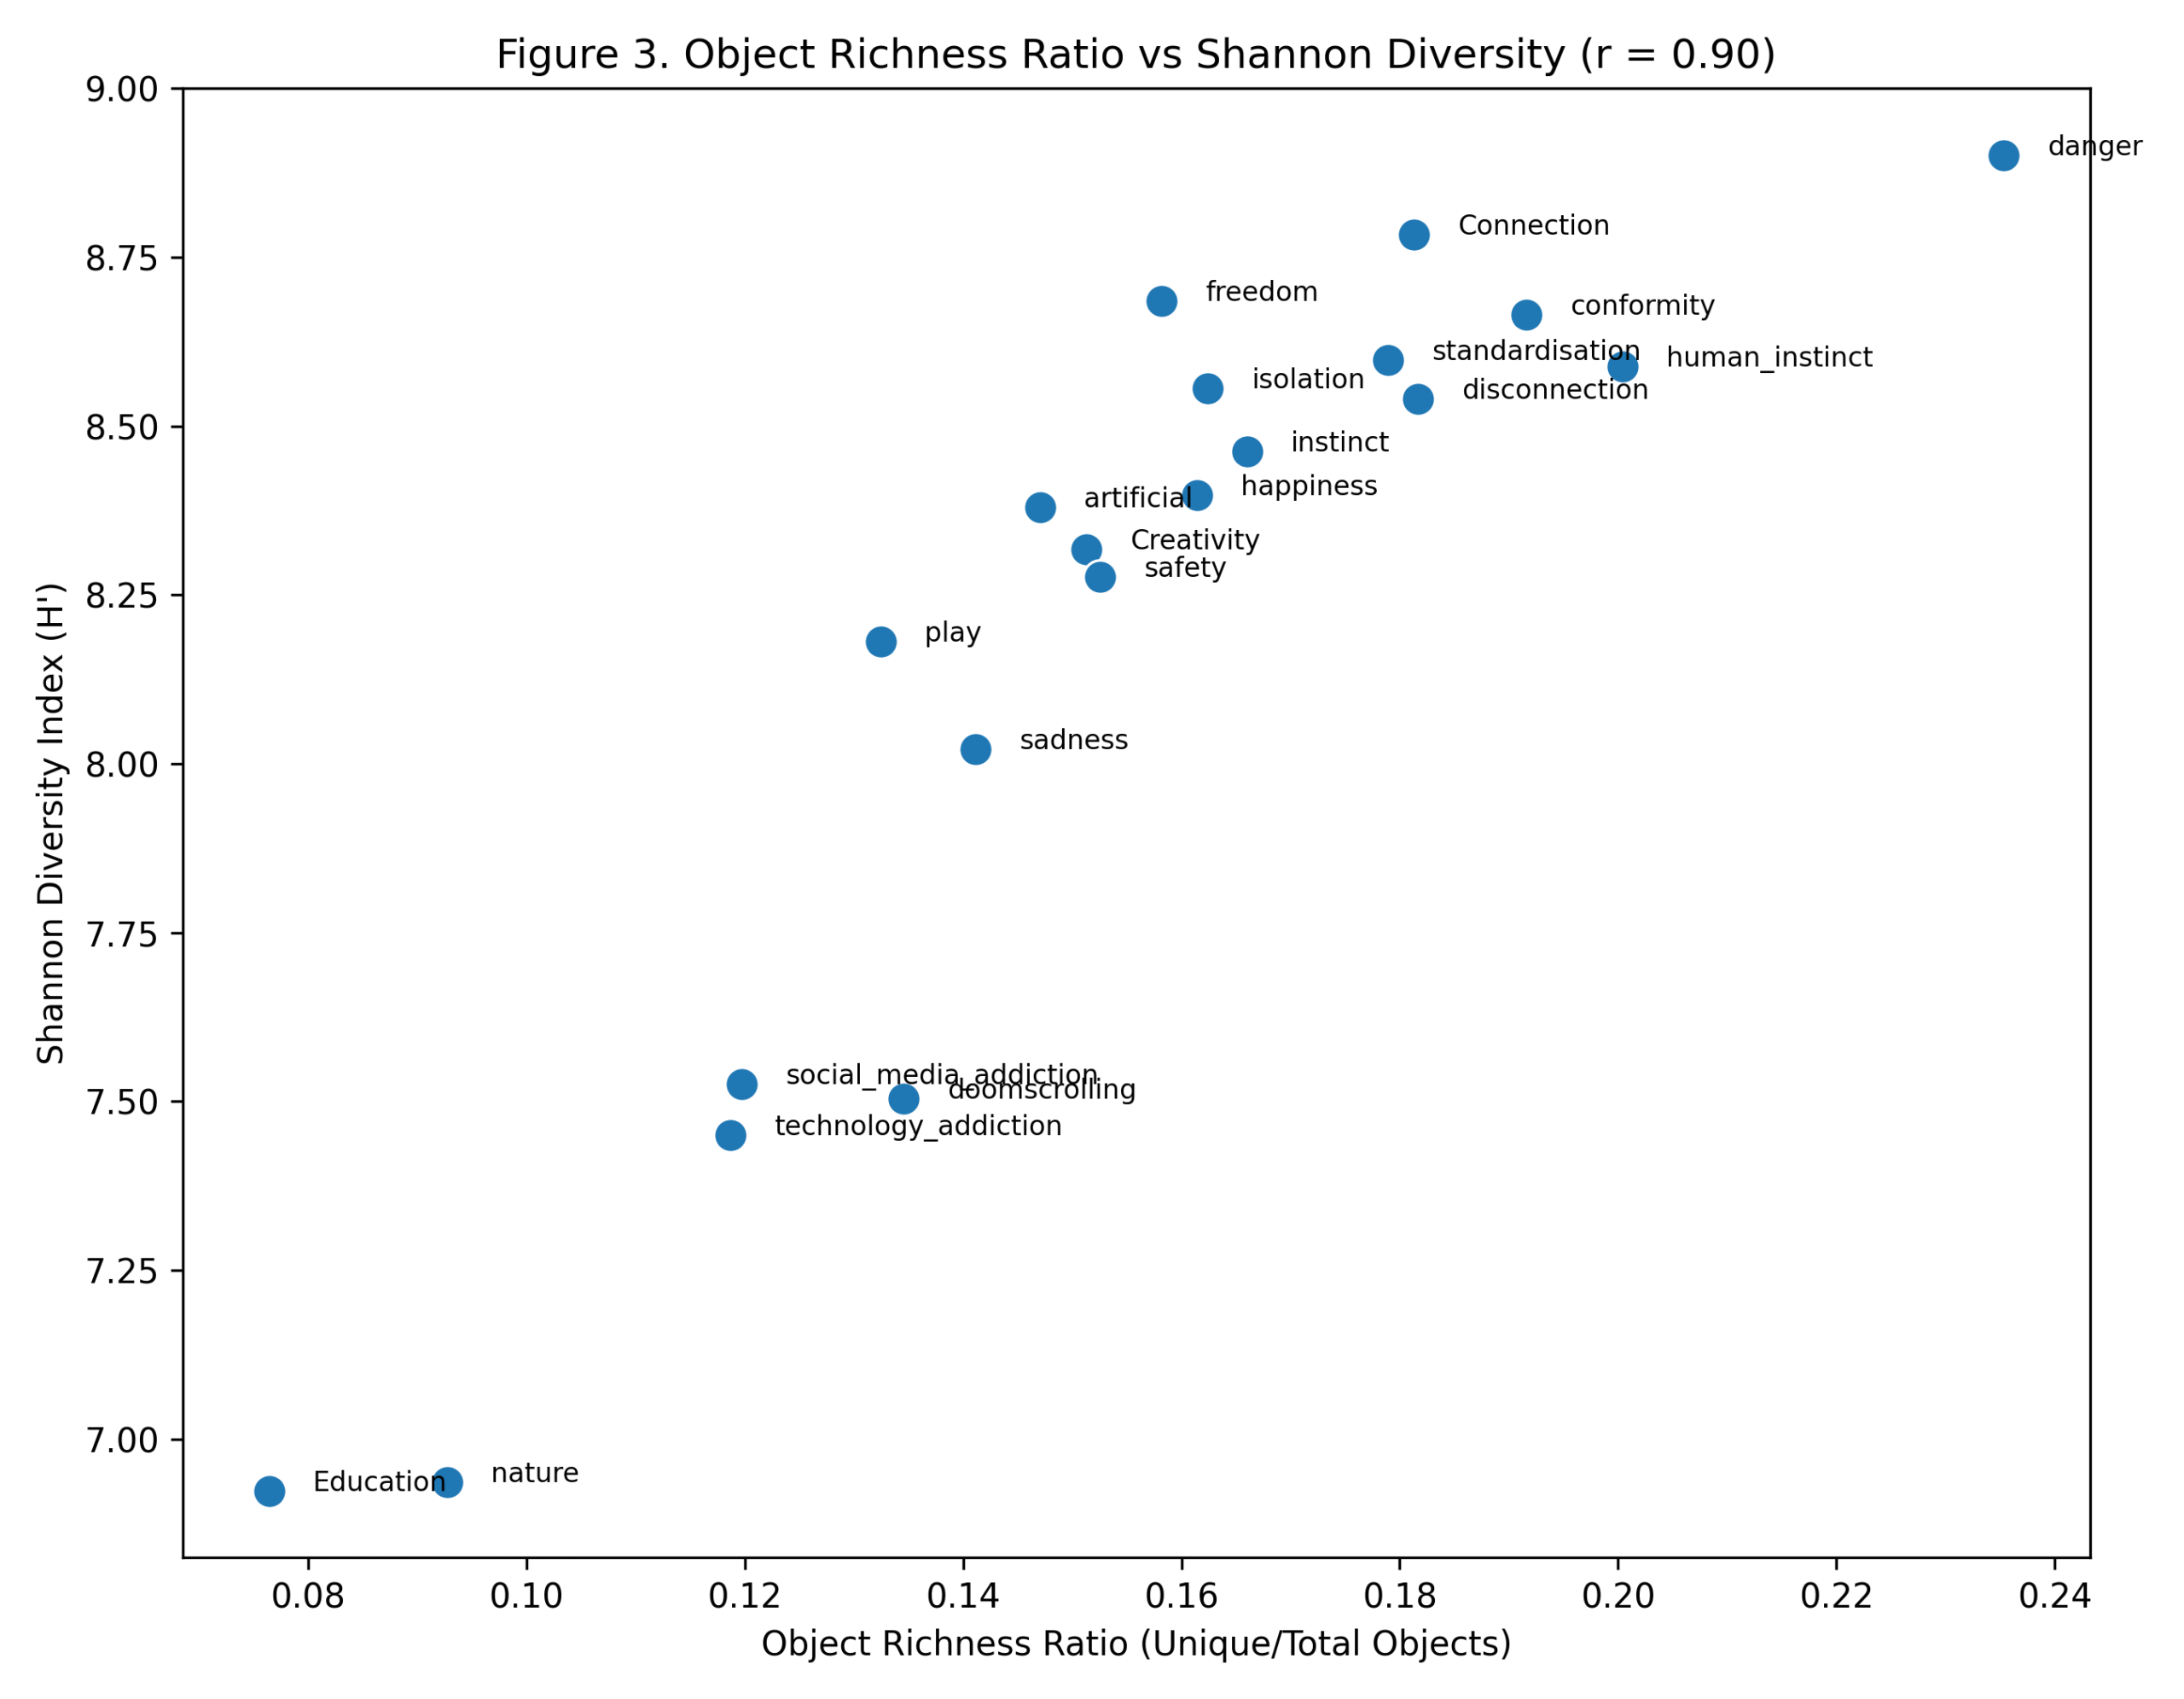
- Object richness ratio (r = 0.907, p < 0.001): Strong relationship between diversity and the proportion of unique to total objects
Negative Correlation with average objects per image (r = -0.523, p = 0.018) suggests that visually diverse categories achieve richness through variety rather than quantity, supporting the theoretical distinction between visual complexity and visual clutter.
Object Novelty Analysis
The analysis of new objects per image reveals diminishing returns in visual novelty as category size increases. Categories with highest novelty rates (“danger”: 3.62, “human_instinct”: 3.05) demonstrate sustained introduction of novel visual elements, while “Education” (1.30) and “Nature” (1.65) show rapid convergence to stereotypical representations.
- Statistical Significance: The weak negative correlation between category size and novelty (r = -0.158, p = 0.505) suggests that larger datasets do not necessarily yield proportionally more diverse content, indicating potential saturation effects in visual representation of abstract concepts.
Theoretical Implications
The findings support the hypothesis that abstract psychological concepts (“danger”, “freedom”, “connection”) require more diverse visual metaphors than concrete domains (“nature”, “education”). This aligns with conceptual metaphor theory, where abstract concepts necessitate varied visual instantiations due to their inherent complexity and cultural variability.
The strong correlation between Shannon diversity and object richness ratio (1:12.5 to 1:4.2 range) provides empirical evidence for the efficiency of diverse visual vocabularies in representing complex conceptual categories, with implications for computer vision applications in semantic understanding and content generation.