Dataset Description
Specialised Analyses and Validation
Diversity Metric Validation
Shannon Diversity Index was evaluated against two alternative metrics: Simpson’s Index and the Berger-Parker Index. Both showed strong convergent validity (r = 0.943 and r = –0.841 respectively), confirming that Shannon diversity reflects genuine differences in visual diversity rather than methodological artefacts.
To assess stability, five-fold cross-validation was performed. Although the mean absolute error was higher than ideal (0.521, where < 0.15 is preferred), the overall diversity pattern remained interpretable. Threshold sensitivity was also examined by simulating detection confidence changes between 0.80 and 0.95. Correlations with the baseline (0.87) diversity scores were consistently high (r > 0.996), indicating strong stability across reasonable detection parameters.
Split-half reliability was used to examine internal consistency of diversity scores within categories. Results showed a weak correlation (r = –0.342), suggesting that in some cases, diversity scores may depend on which images are included. This highlights a potential limitation for categories with fewer images or more variable content.
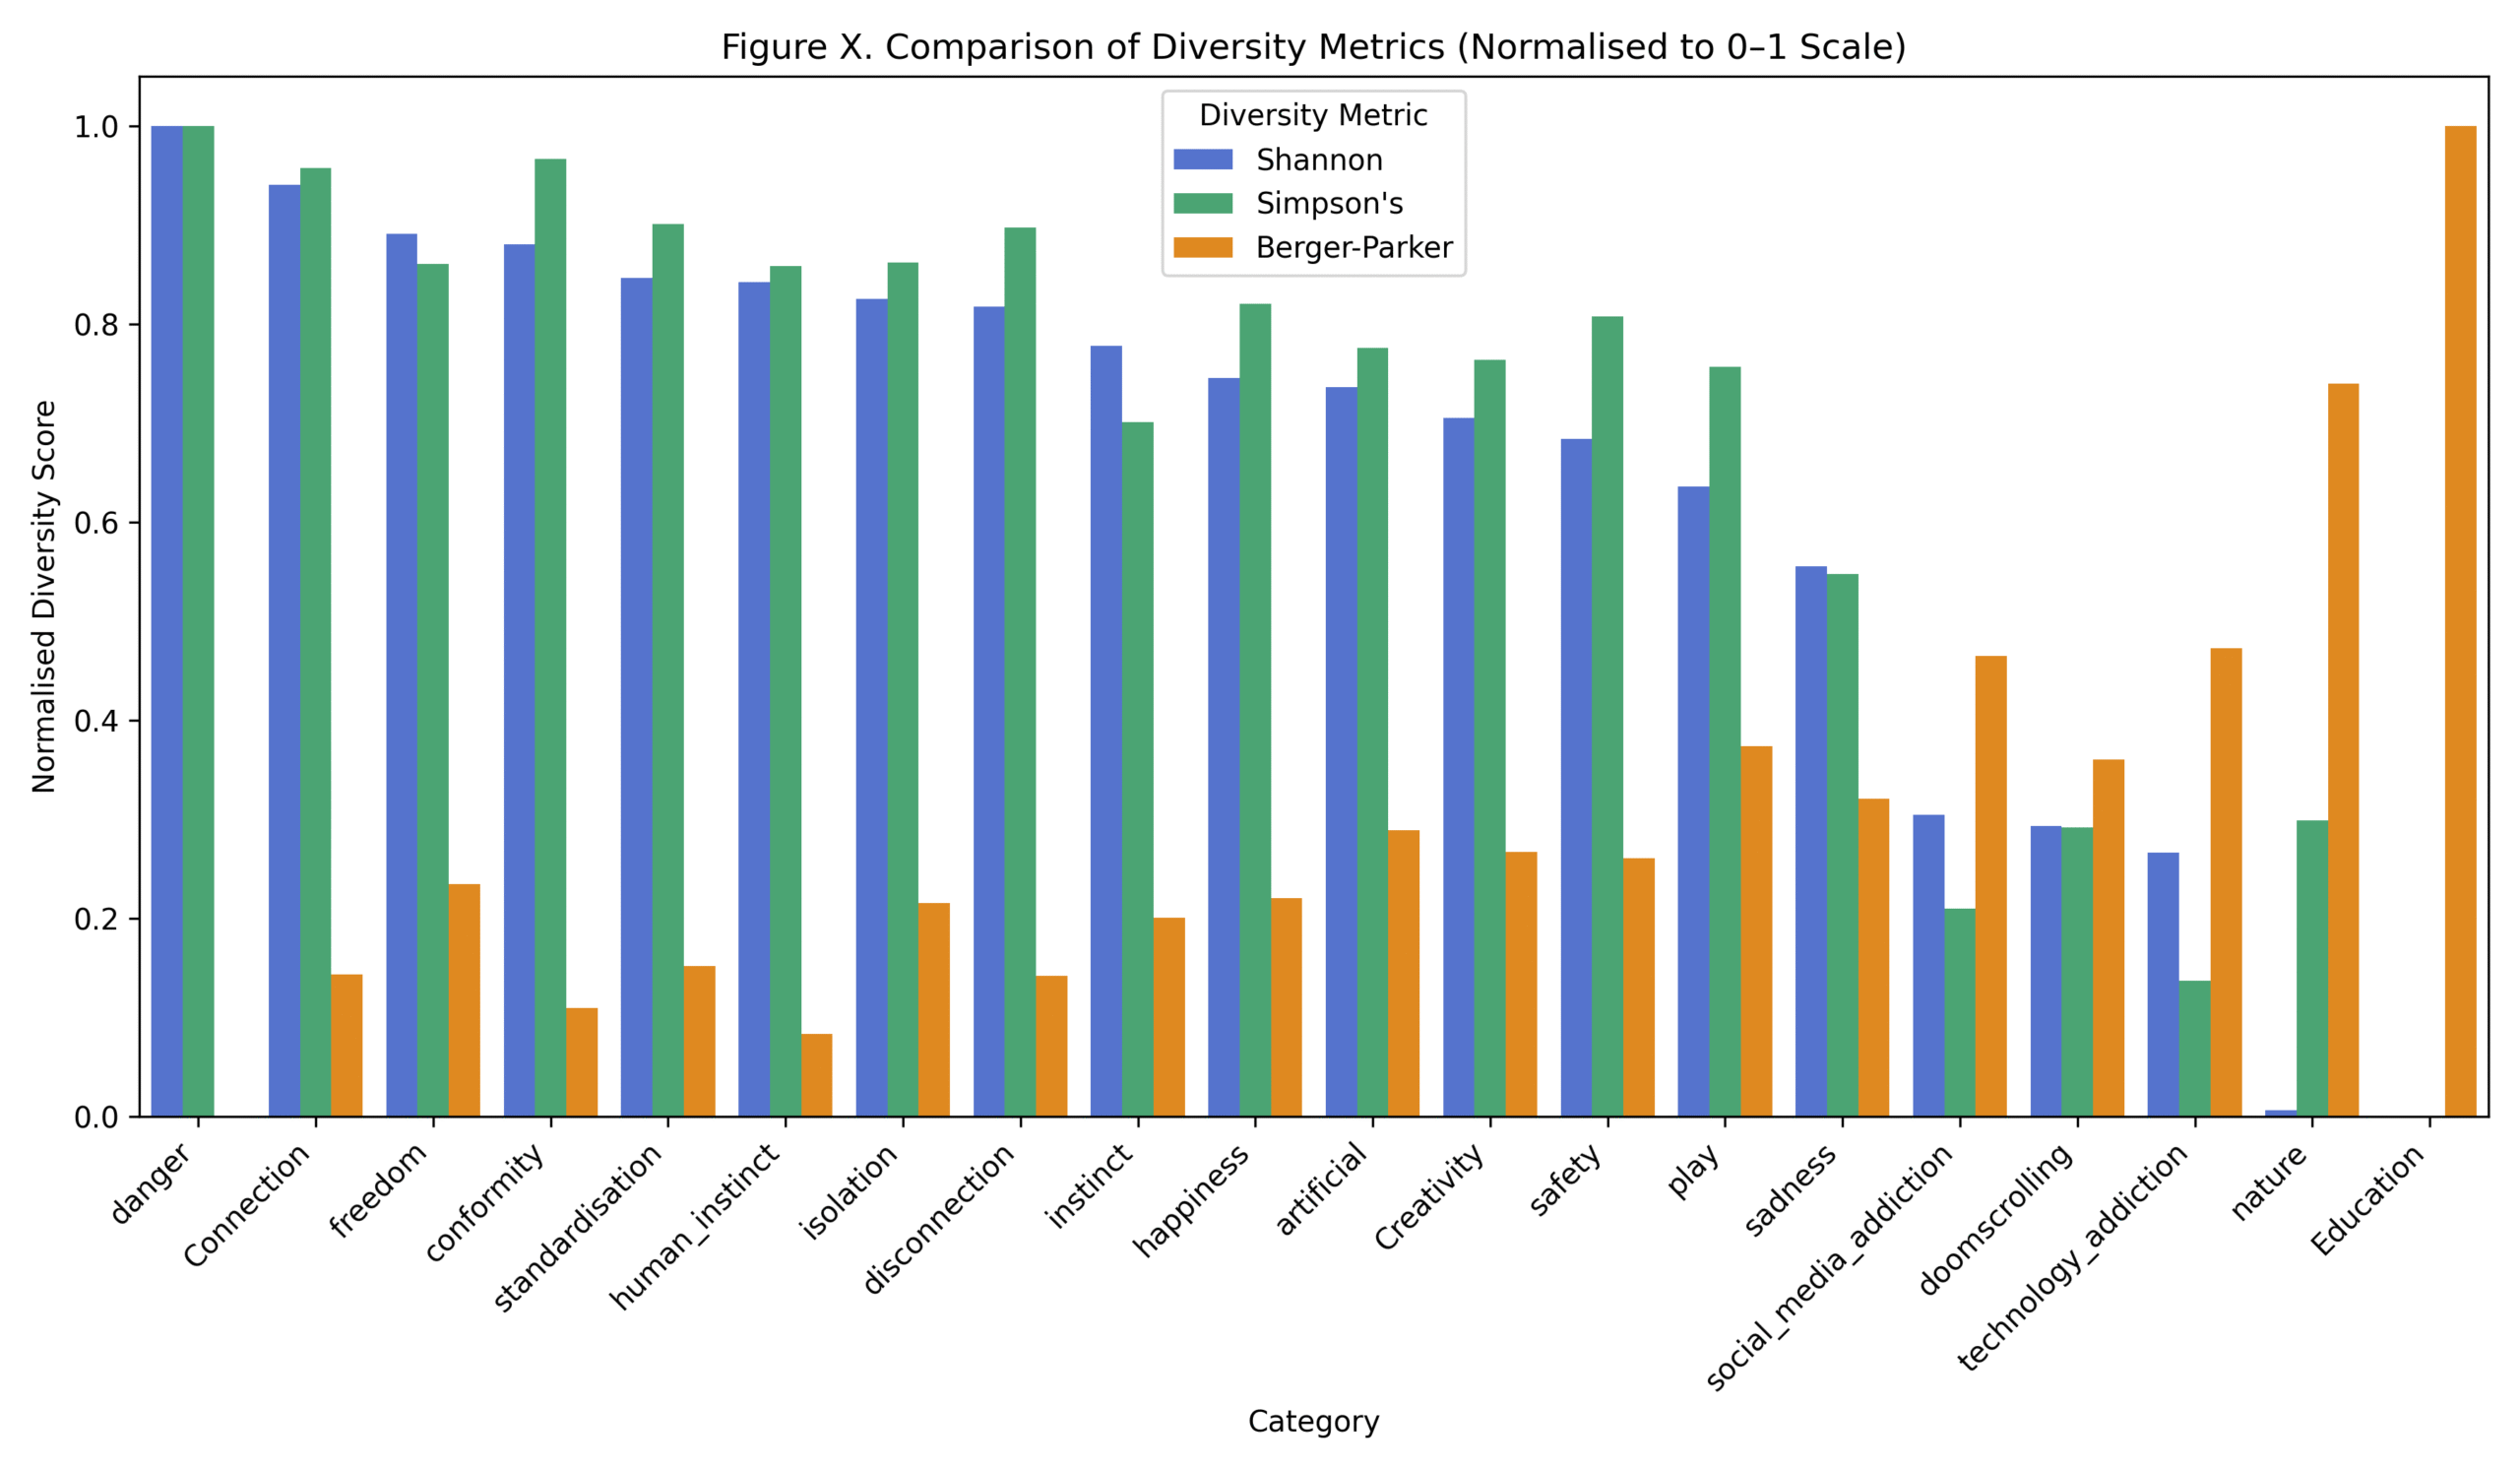
Figure 1 – Comparison of Diversity Metrics across Categories
Normalised values (0–1 scale) for Shannon Diversity, Simpson’s Index, and Berger-Parker dominance are shown for each category. Although the metrics use different calculations, they follow similar patterns across categories, supporting the validity of the Shannon index as a measure of diversity.
Temporal and Spatial Considerations
Potential temporal and spatial biases were assessed to ensure results were not artefacts of when or where images were collected. ANOVA showed no significant variation in diversity across years (F = 1.18, p = 0.348), and a chi-square test revealed no meaningful spatial clustering (χ² = 0.56, df = 3, p = 0.907). Diversity scores appear to be stable across both time and geography.
Bias Assessment and Correction
To examine representation bias, a chi-square goodness-of-fit test was used to compare category detection frequencies against a uniform distribution. Results approached significance (χ² = 29.79, df = 19, p = 0.054), suggesting possible over- or under-representation of certain categories.
To address this, inverse probability weighting was applied. A bias-corrected correlation between unique object count and diversity was calculated using bootstrap resampling (1,000 iterations). The mean corrected r = 0.523, but with a wide 95% confidence interval [–0.037, 0.814], indicating that while the trend persists, the strength of association may be affected by category-level detection differences.
Robustness Testing
Several tests were conducted to check that findings were not dependent on specific assumptions or outlier effects. Removing the two most influential outliers (Education and nature) did not change the core conclusions; the correlation remained strong (r = 0.969).
Alternative correlation methods were also used. Spearman’s ρ = 0.924 and Kendall’s τ = 0.791 supported the direction and strength of the original Pearson correlations. In addition, results from a standard t-test (t = 4.88, p < 0.001) were confirmed by a Mann–Whitney U test (U = 96.0, p = 0.001), reinforcing the robustness of group comparisons.
Summary
Taken together, these analyses confirm that Shannon diversity provides a valid and interpretable measure of category-level visual diversity. Metric convergence, threshold stability, and robust results across alternative tests all support the reliability of the findings. Some limitations remain particularly around internal consistency and category representation but these do not undermine the main conclusions.
Overall, diversity appears to be driven by meaningful visual and conceptual differences, not artefacts of data structure or methodology.