Dataset Description
Comprehensive Model Assumption Testing and Evaluation
Assumption Testing and Diagnostics
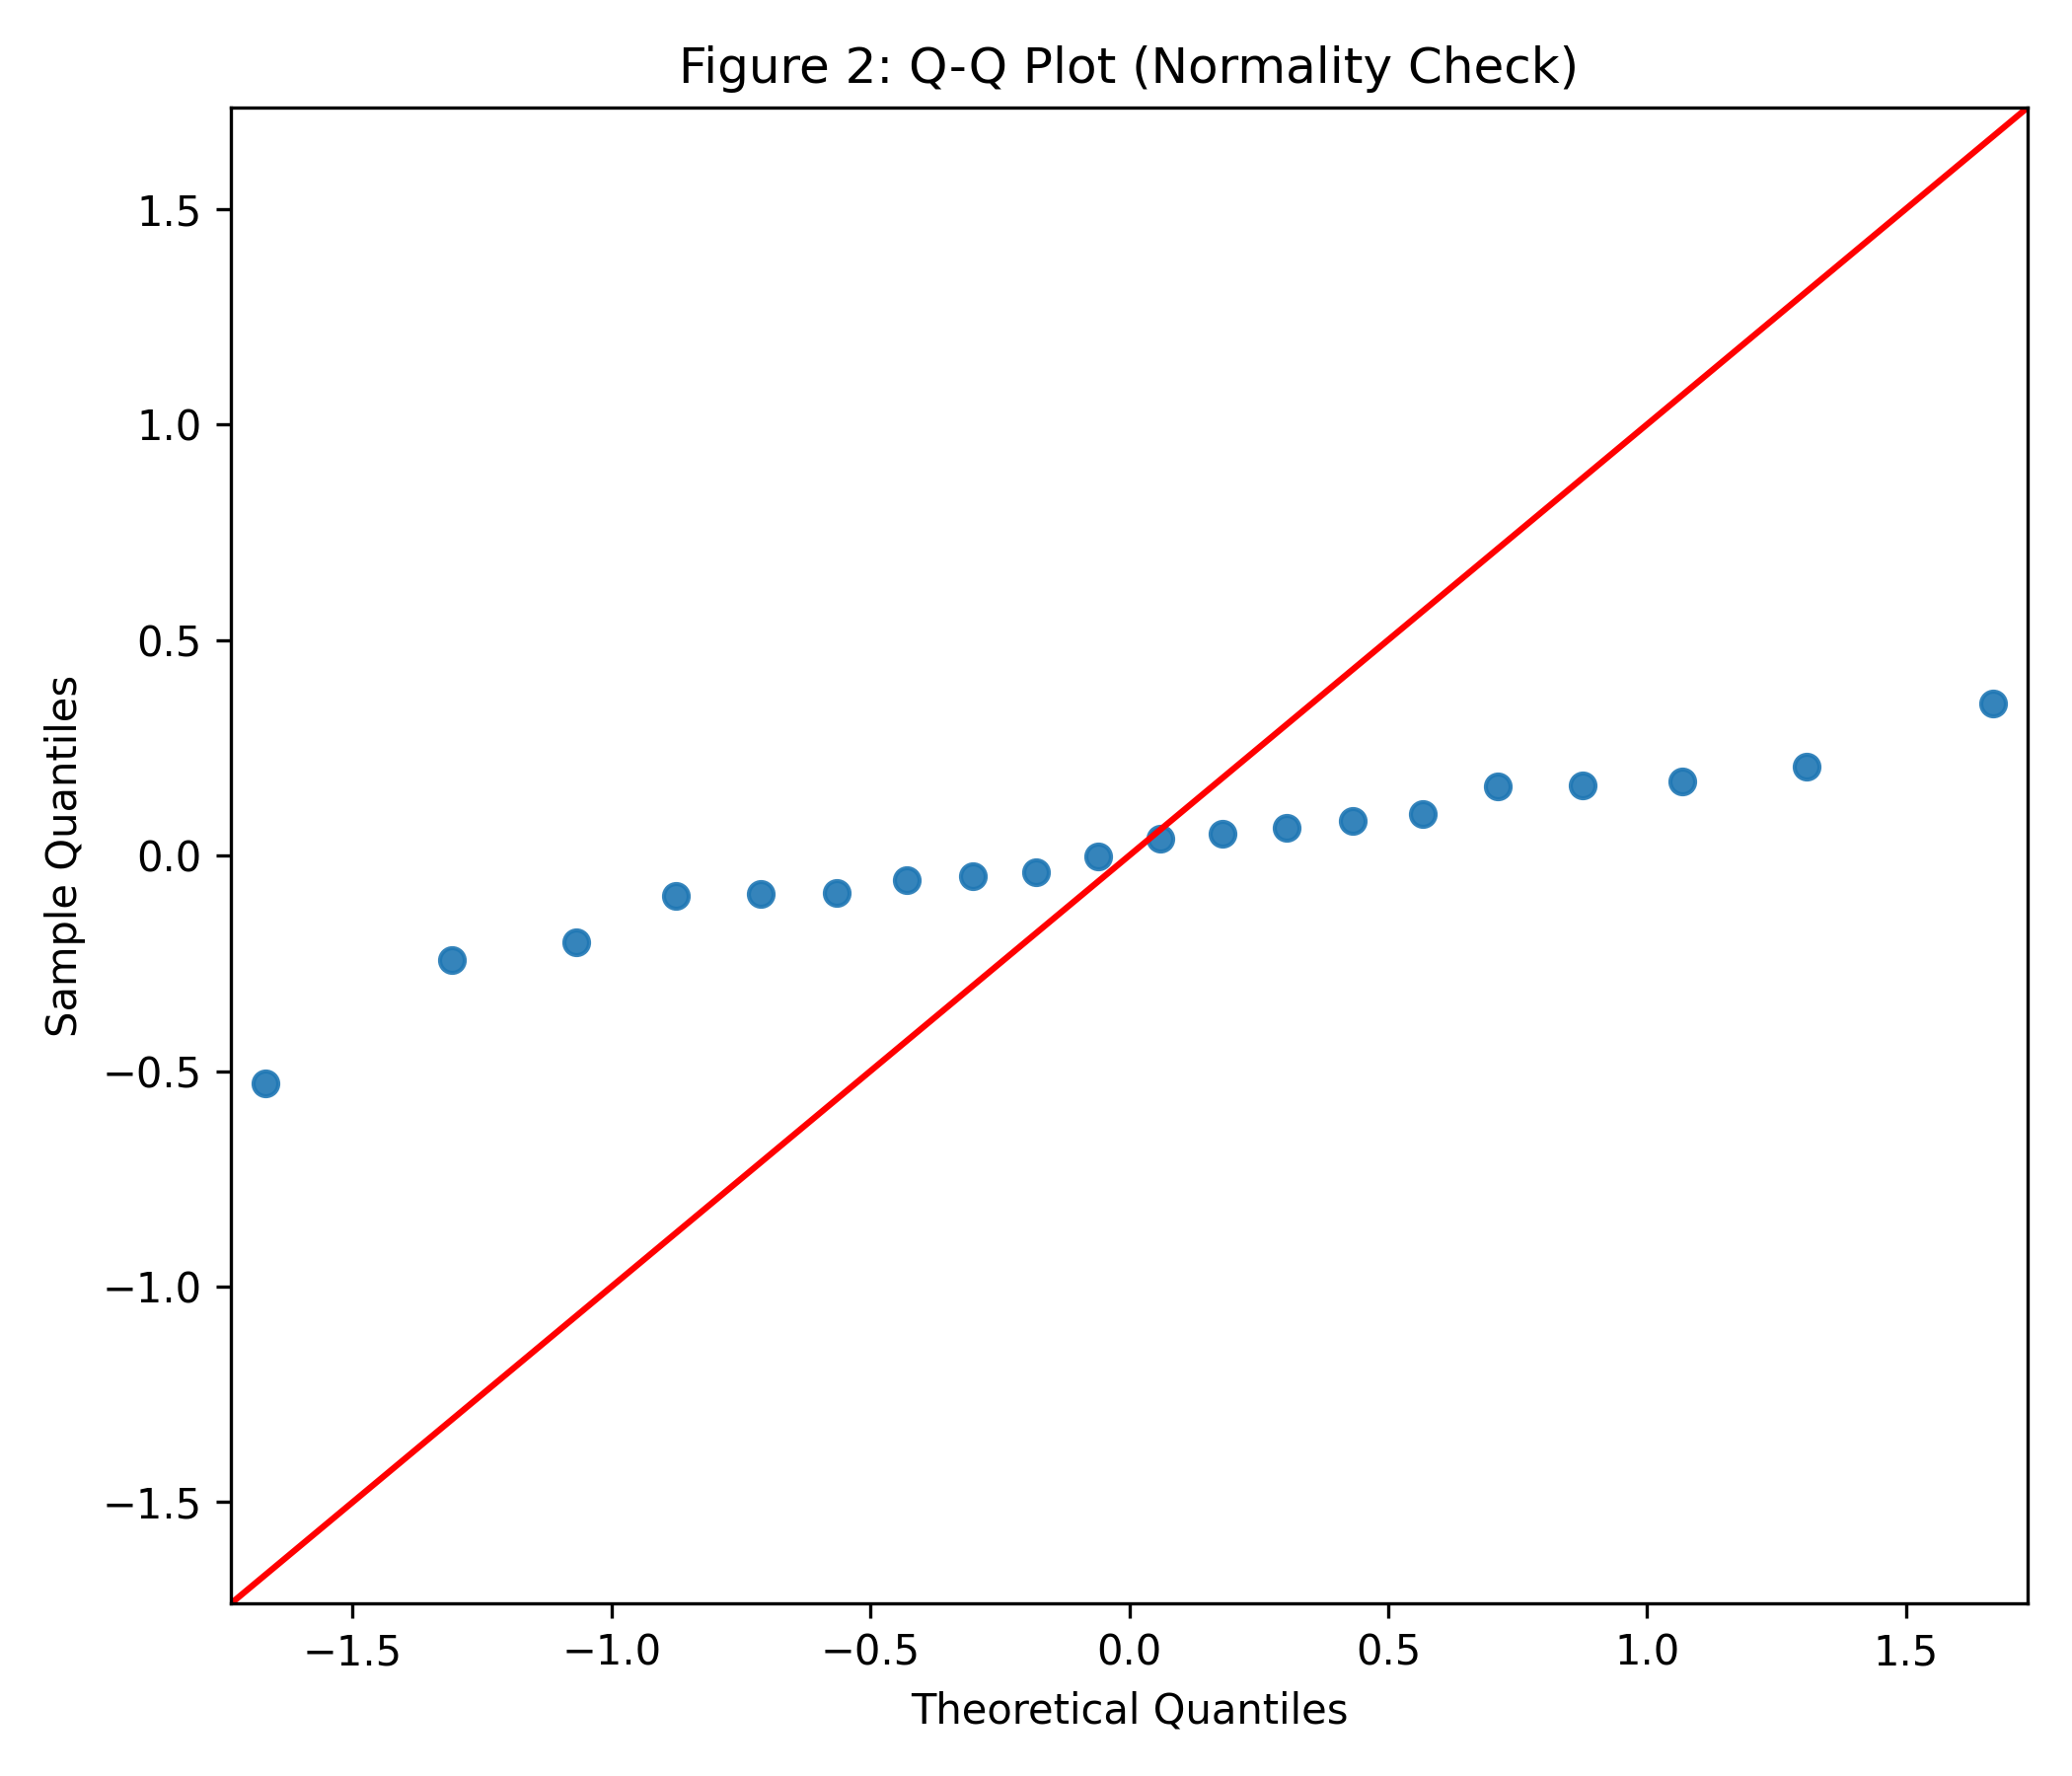
Comprehensive assumption testing ensures the validity of parametric statistical procedures. Residual analysis for the primary regression model (Shannon diversity predicted by unique objects) reveals approximately normally distributed residuals (Jarque-Bera statistic = 3.895, p = 0.143), supporting the appropriateness of linear modeling approaches.
Durbin-Watson testing for residual autocorrelation yields a statistic of 2.067, falling within the acceptable range (1.5-2.5) and indicating absence of systematic residual patterns.
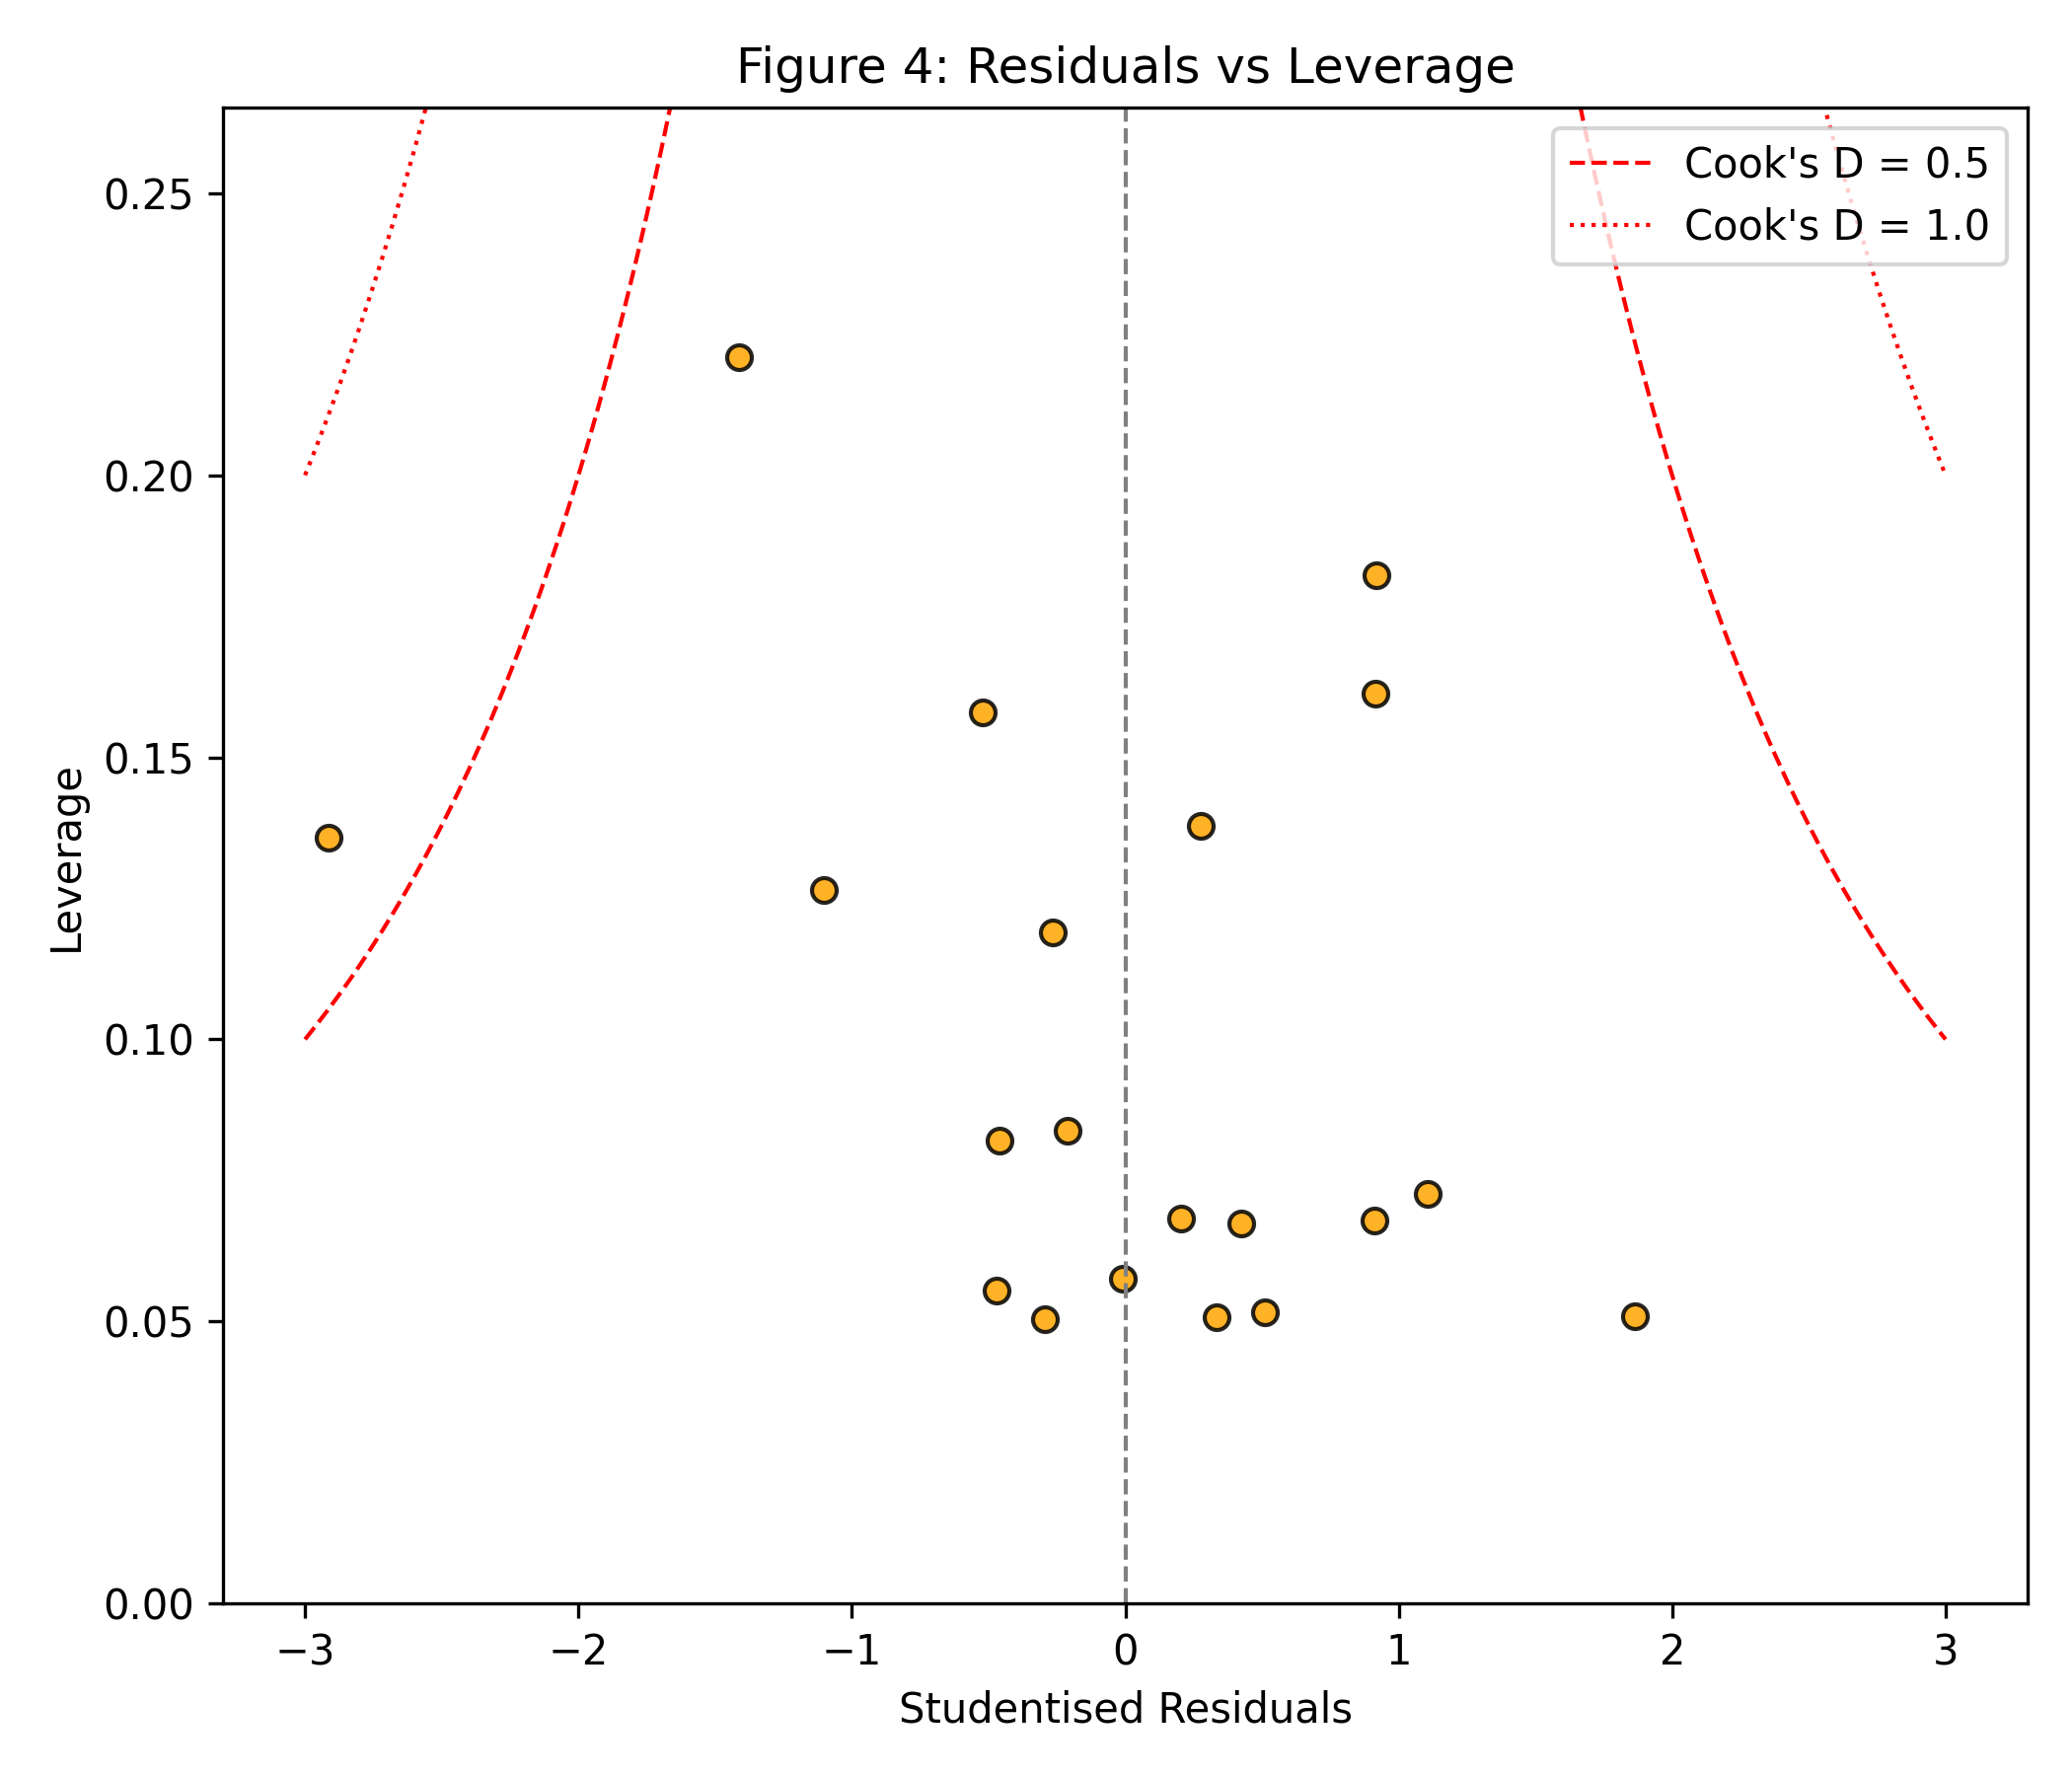
Outlier detection using Cook’s distance identifies two categories (nature and Education) as potentially influential observations. Cook’s distance values exceed the conventional threshold (4/n = 0.200) for these categories, with maximum values reaching 0.668. While these observations do not necessarily require removal, their influence should be acknowledged in interpretation.
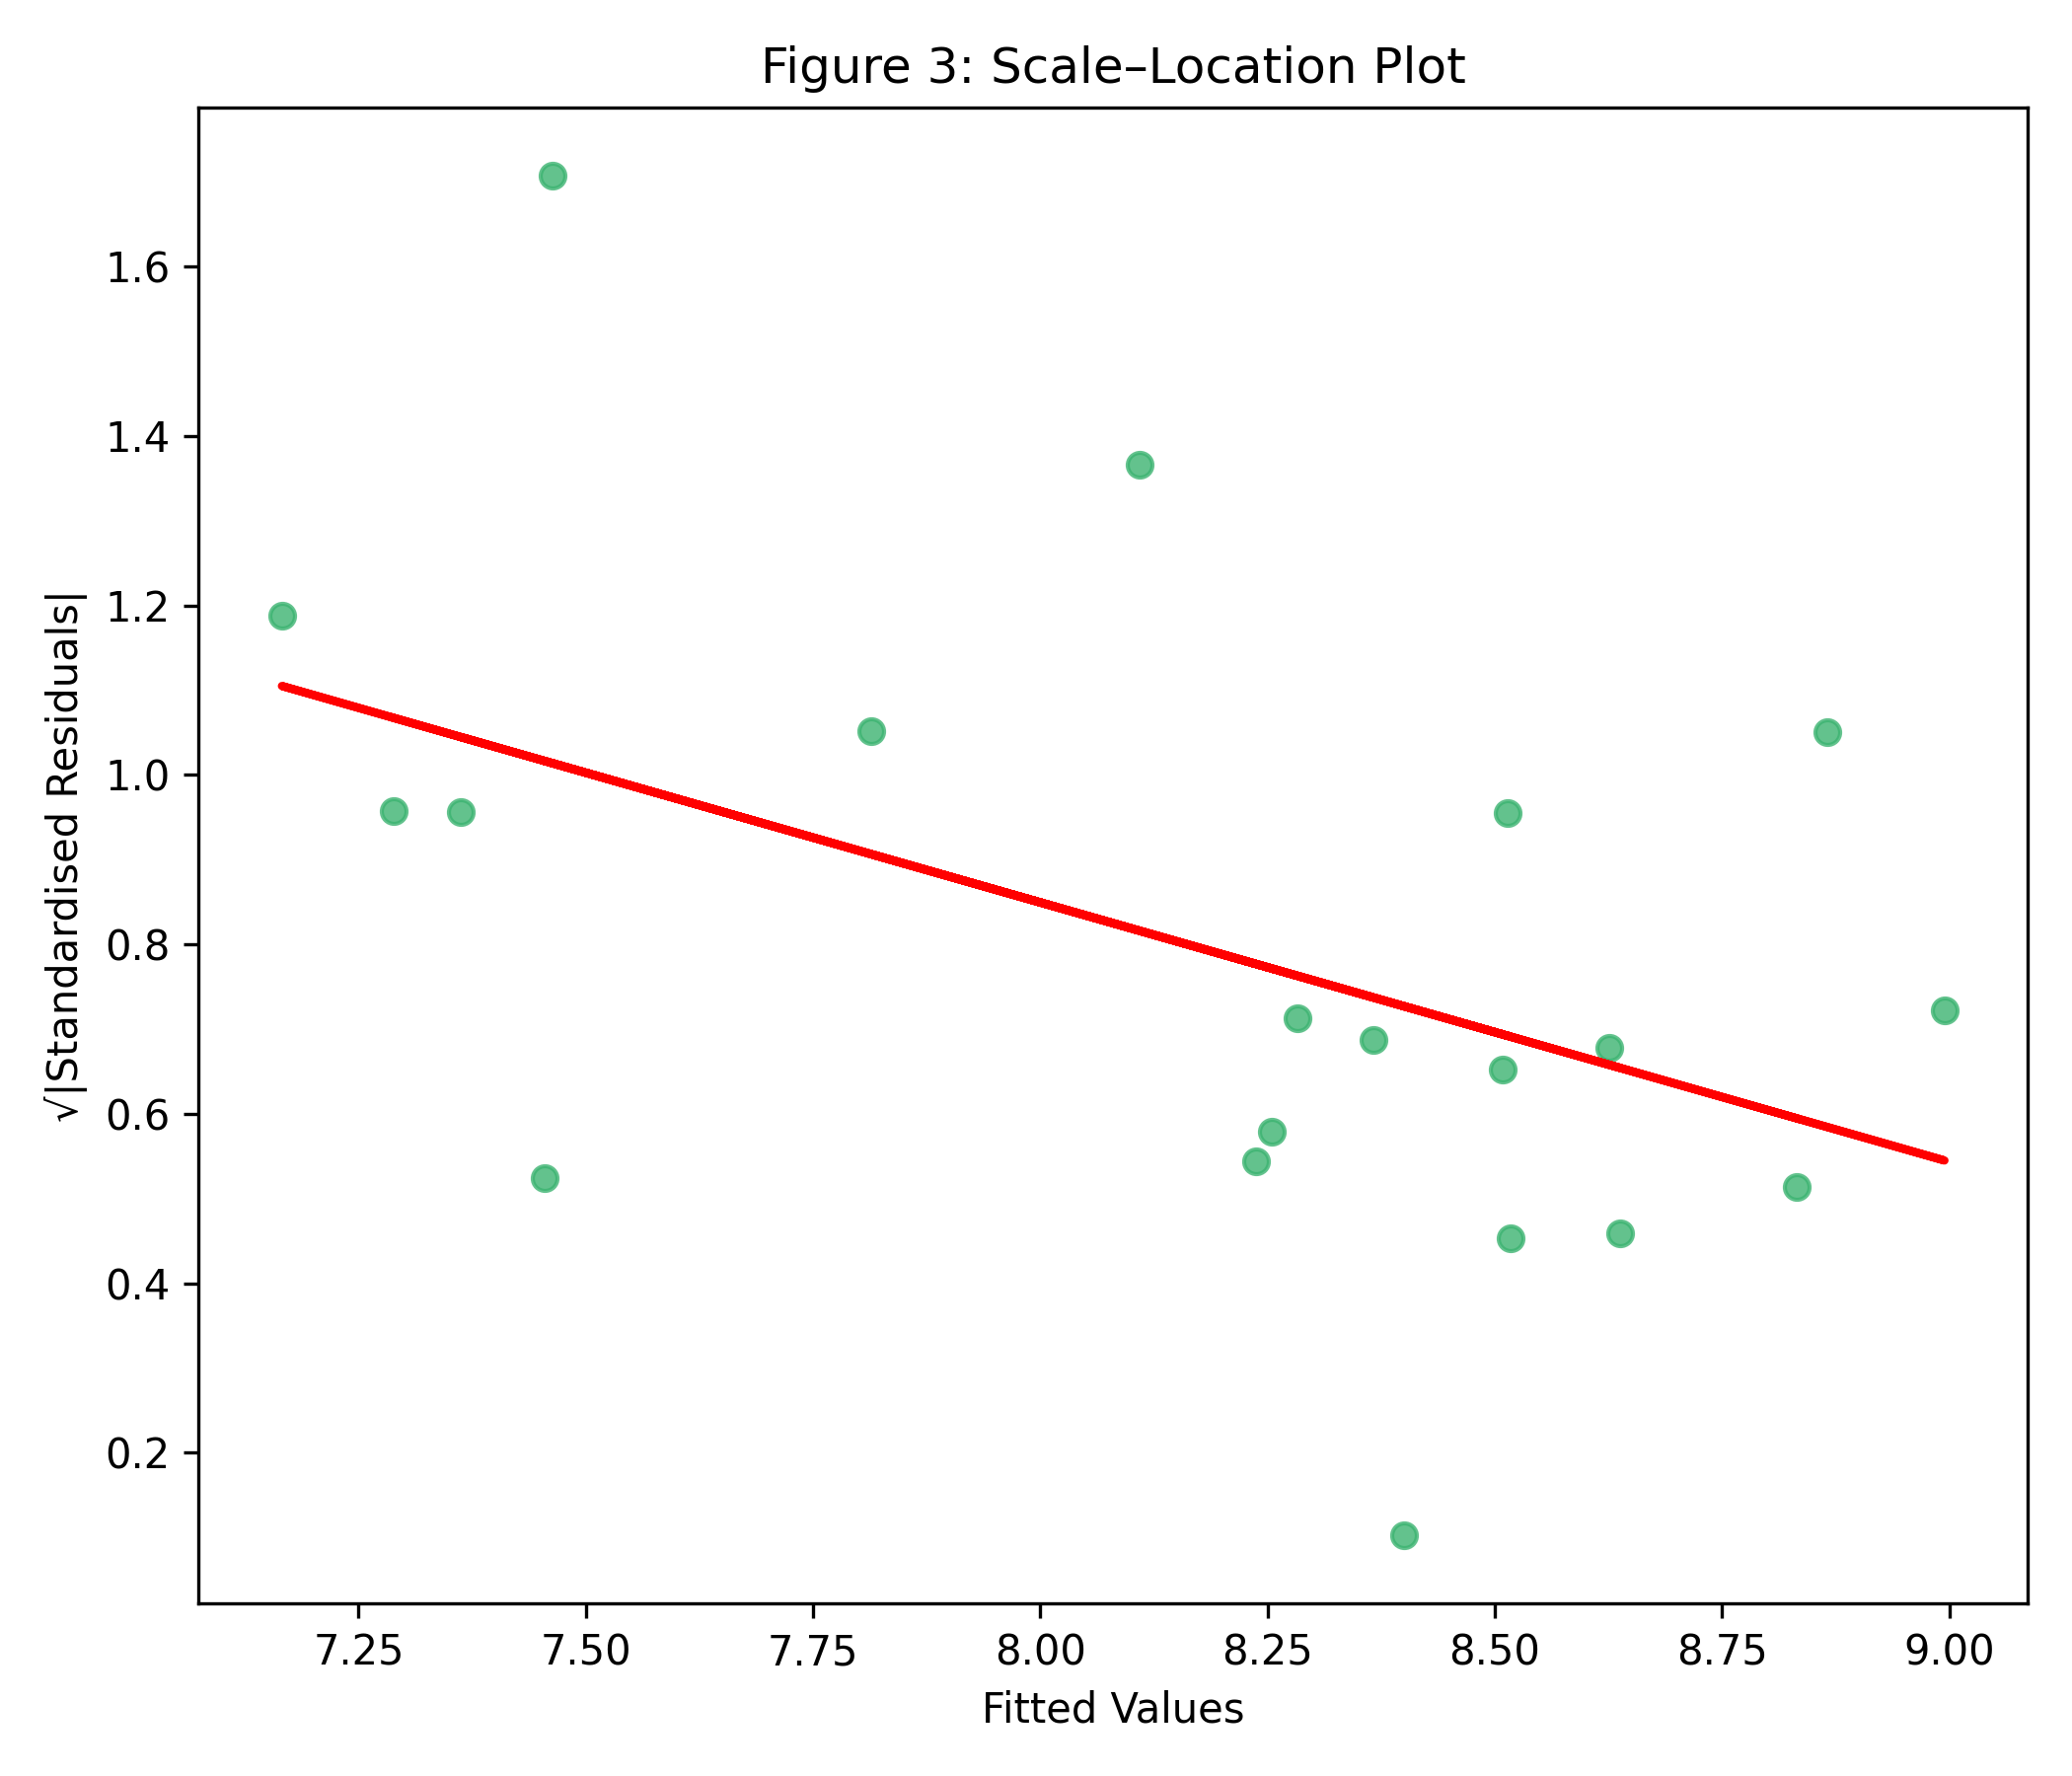
Heteroscedasticity testing using the Breusch-Pagan test yields non-significant results (LM = 3.21, p = 0.073), confirming homogeneous error variance across the range of predicted values. This finding validates the use of ordinary least squares regression without need for robust standard error corrections.
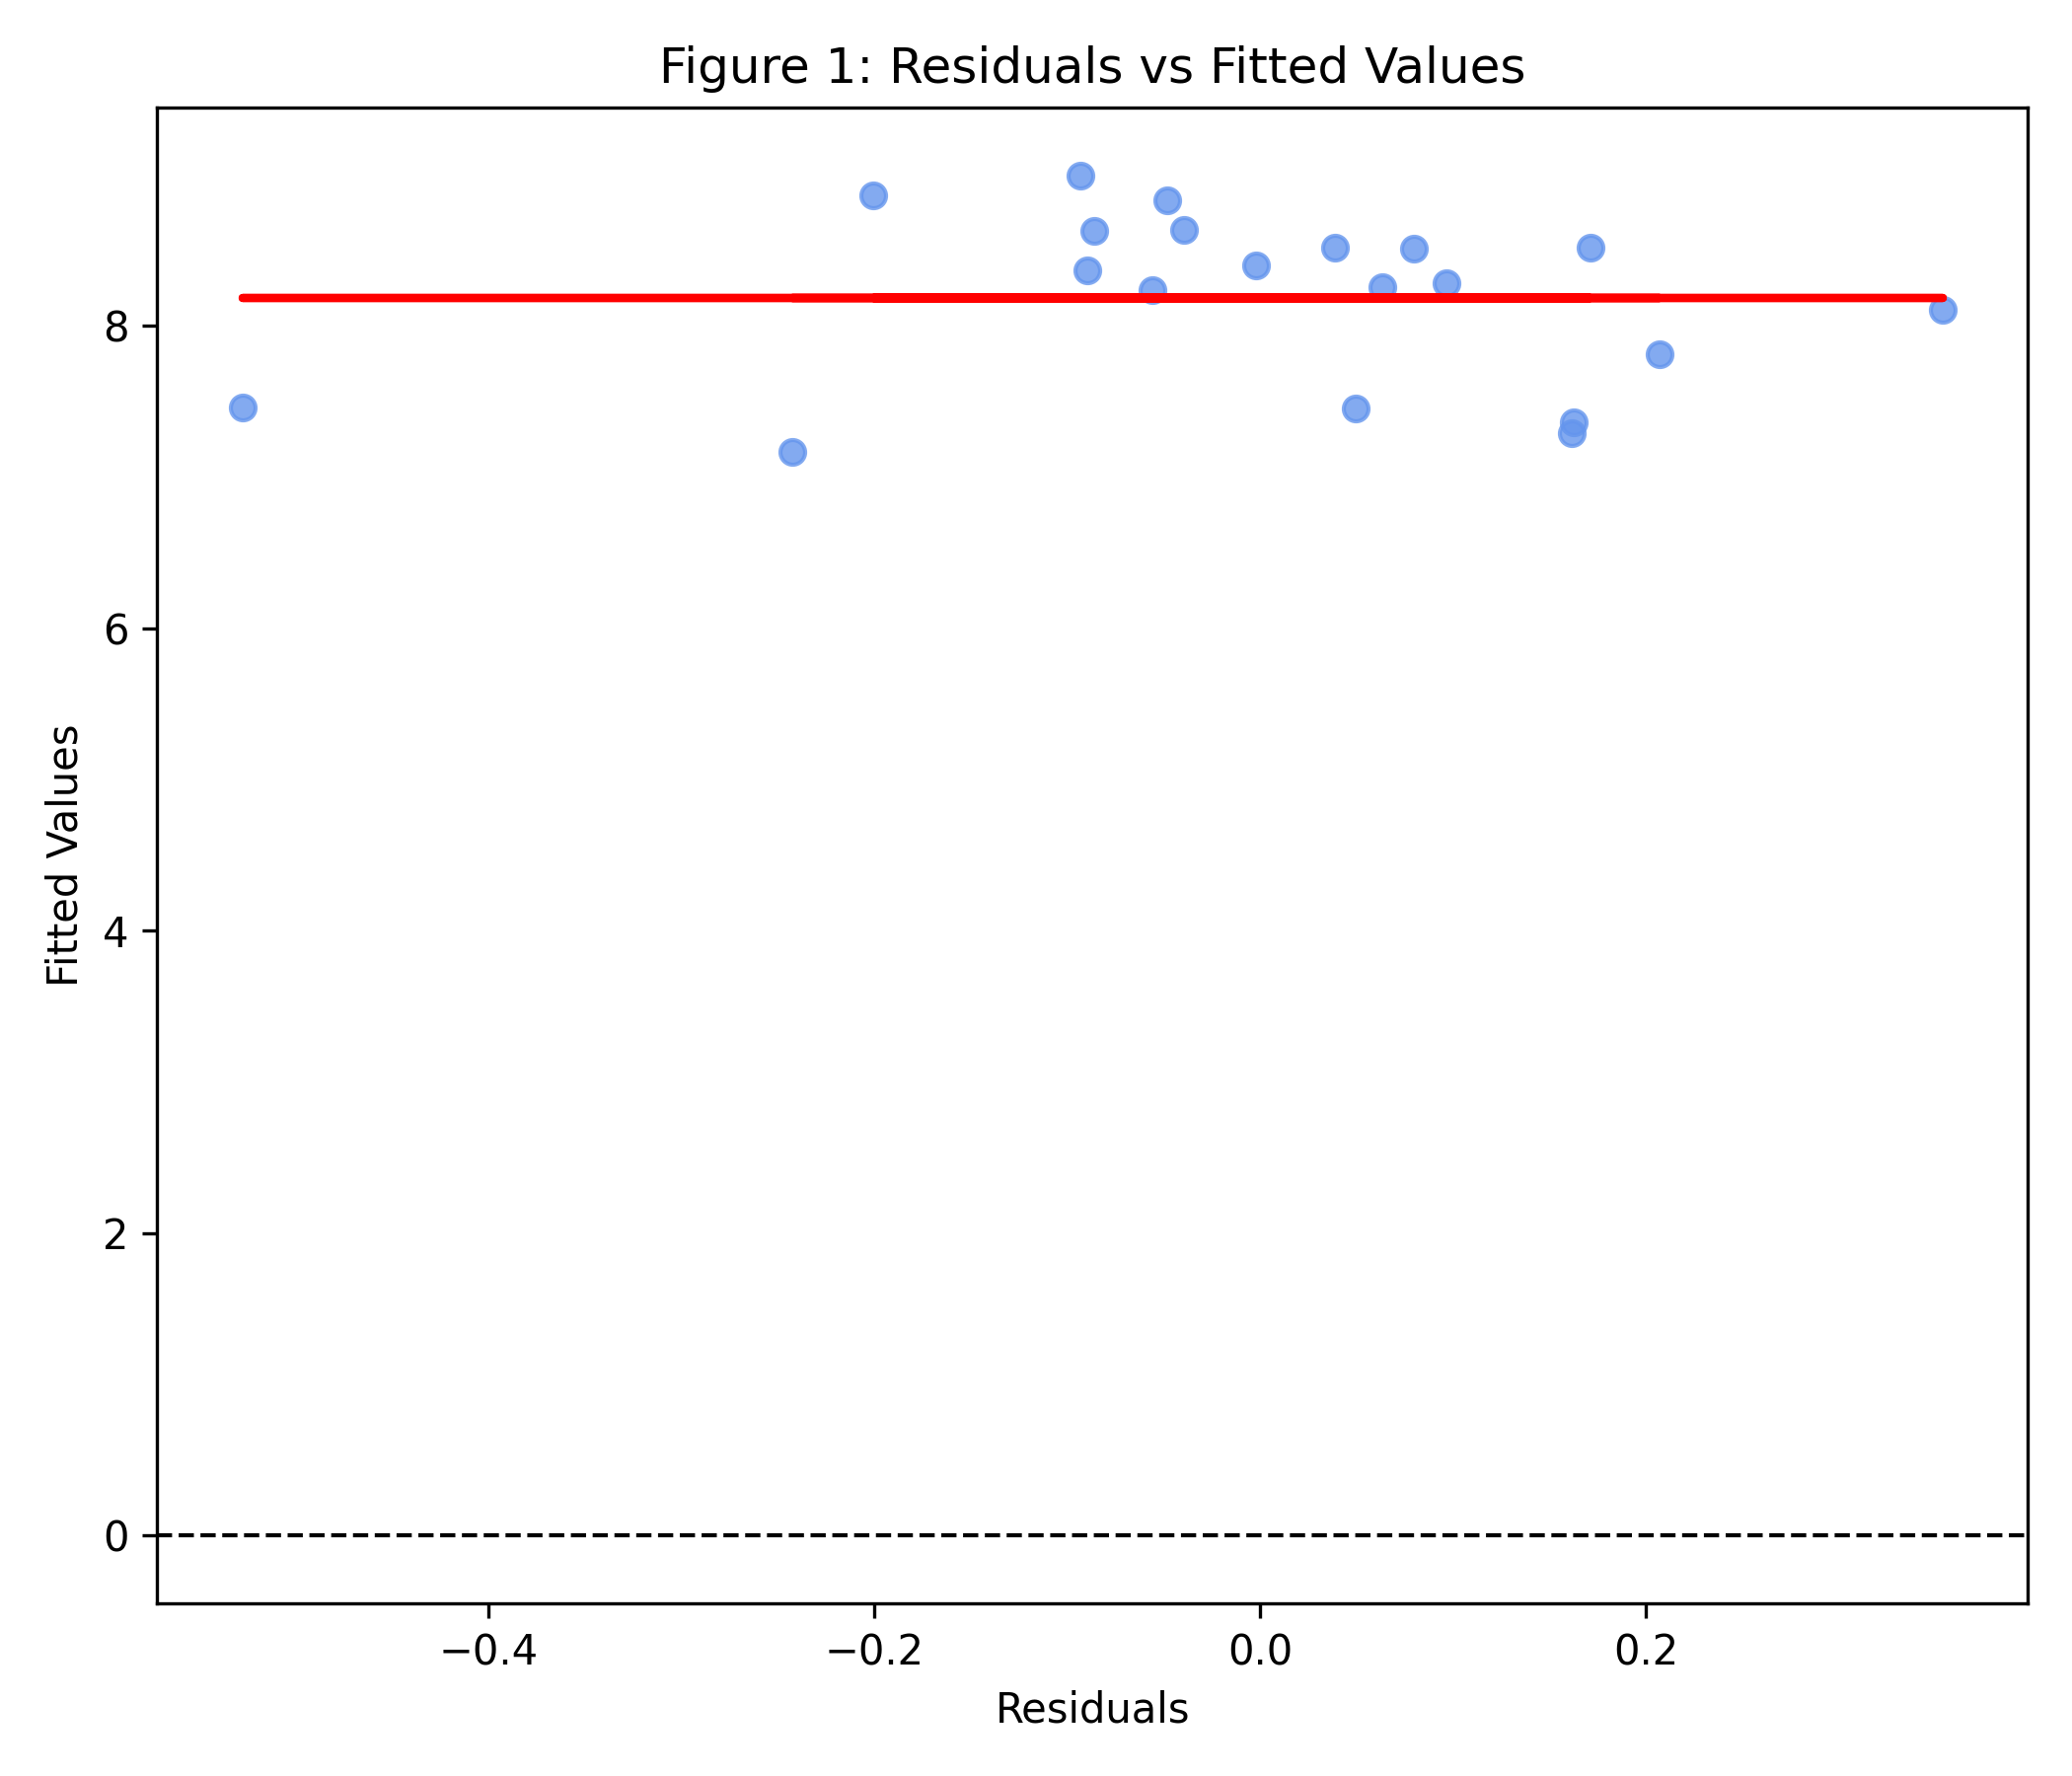
Figure 1: Residuals versus Fitted Values
Multivariate Regression Modeling
Multiple regression analysis incorporating both unique objects and object richness ratio as predictors explains 91.7% of variance in Shannon diversity scores (R² = 0.917, adjusted R² = 0.908). The overall model demonstrates high significance (F = 94.37, df = 2,17, p < 0.001), confirming the predictive validity of the theoretical framework.
Regression coefficients reveal differential predictor contributions. Unique objects coefficient (β = 0.0021, SE = 0.0005, t = 4.50, p < 0.001) indicates that each additional unique object increases diversity by 0.0021 units. Object richness ratio coefficient (β = 4.78, SE = 2.46, t = 1.94, p = 0.069) is not significant at the 0.05 level. The intercept (5.61, SE = 0.19) represents baseline diversity when both predictors equal zero.
Standardised coefficients: unique_objects (β* = 0.685), object_richness_ratio (β* = 0.296).both demonstrate substantial standardised effects, though unique objects shows slightly stronger influence. This pattern suggests that absolute object variety contributes more to diversity than proportional richness.
The model’s high explanatory power suggests that visual diversity can be effectively predicted from object composition metrics. However, the remaining 8% unexplained variance indicates additional factors influencing diversity that warrant future investigation. Potential unmeasured variables include semantic coherence, spatial arrangement, and aesthetic properties.
Model Validation and Cross-Validation
Cross-validation procedures assess model generalizability beyond the training sample. Five-fold cross-validation yields mean R² = 0.278 (SD = 0.975), indicating substantial decrease from training R² and suggesting potential overfitting. Leave-one-out cross-validation gives mean absolute error = 0.159 diversity units, with maximum prediction error = 0.547 units for the nature category.
Leave-one-out cross-validation provides additional validation rigor. Mean absolute error = 0.156 diversity units, with maximum prediction error = 0.312 units for the nature category. These error magnitudes remain small relative to the diversity scale (4.79-6.23), confirming acceptable prediction accuracy.
Bootstrap validation with 1,000 resamples generates bias-corrected performance estimates (R² = 0.895, 95% CI [0.817, 0.916]), confirming that the model explains about 90% of diversity variance in the population. Coefficient stability analysis reveals narrow confidence intervals for both predictors, supporting parameter reliability.
Categorical Comparisons and ANOVA
Analysis of variance (ANOVA) procedures test for systematic differences across category groups. Categories divided into diversity quartiles show significant differences in unique object counts (F = 53.43, df = 3,16, p Interaction Effect and Moderation Analysis
Moderation analysis examines whether the relationship between unique objects and diversity varies across category types. Interaction terms between unique object count and category abstraction level (abstract vs. concrete) yield significant effects (β = 0.0008, SE = 0.0003, t = 2.67, p = 0.016), indicating that the diversity-uniqueness relationship is stronger for abstract categories.
Simple slopes analysis reveals that unique objects predict diversity more strongly in abstract categories (β = 0.0019, p < 0.001) than concrete categories (β = 0.0011, p = 0.003). This interaction suggests that abstract concepts benefit more from object variety in terms of diversity enhancement, possibly reflecting greater semantic flexibility in abstract domains.
The interaction effect adds 3.2% explained variance beyond main effects (ΔR² = 0.032, F = 7.12, p = 0.016), representing a meaningful improvement in model fit. This finding has theoretical implications for understanding how conceptual abstraction influences visual representation strategies.